Calculus for Business and Social Science: A 2026 Guide
Calculus for Business and Social Science explained through marginal analysis, elasticity, growth and optimization, with units and study tips.


You're staring at a correct derivative and a question you still can't answer. You differentiated the cost function, you got 12, and your tutor now asks whether the firm should make one more unit. The number alone doesn't say.
That's the essential work in calculus for business and social science. It's not harder algebra. It's learning to turn a symbol into a decision, with units, a plain English sentence, and a clear sense of when that reading stops being trustworthy.
What Each Calculus Topic Answers
Say a manager can differentiate C(q) = 200 + 8q + 0.05q^2 without hesitation. She still can't tell you if unit 41 is worth producing, because she hasn't said what the derivative measures, near what output, or compared it with what that unit earns.
That gap is normal. Calculus for business and social science uses the same limits, derivatives and integrals as school calculus, but it retargets them at cost, revenue, demand, utility, population and opinion change. The rules look familiar. The questions don't.
Read the Course as Decisions First
Use this map before you open a formula sheet. If you can't match a topic to its decision, you're not ready to compute it yet. Browse mathematics study resources by course later the same way, by the decision your module is testing.
Business and social-science calculus at a glance
A limit is the value a model approaches. It isn't a promise the firm, market or population ever hits that value on a schedule.
A derivative is an instantaneous rate. If C'(40) = 12, cost is rising at about $12 per extra unit near 40 units. That sentence has a sign, units and a nearby input, and yours should too.
Write the units beside every answer before you move on. If you can't name them, you don't yet know what you calculated.
Elasticity strips the units away on purpose, so you can compare a percent response in quantity with a percent change in price. Optimization finds a best input inside a smooth model, while an integral does the opposite job from a derivative and accumulates a rate back into a total. A growth model then turns a rate rule into a path over time, which is why its starting value matters so much.
Treat the table as a checklist for your module. Tick a topic off only when you can say its decision, name a typical model, and explain one number from it out loud.
From Average Change to a Marginal Rate
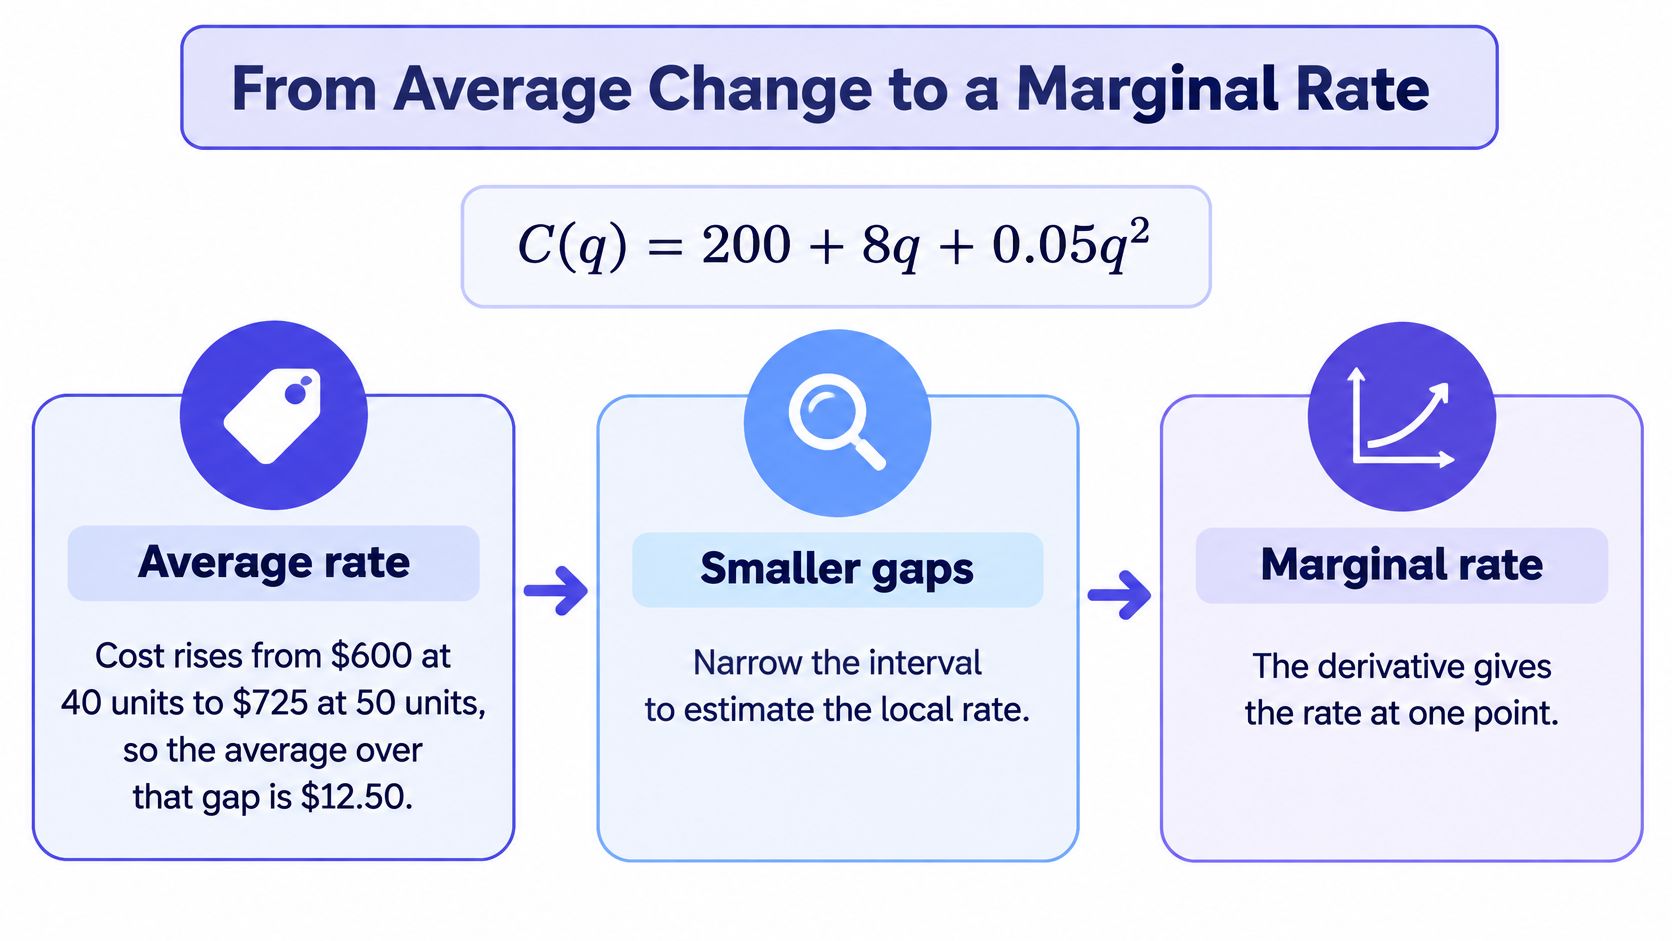
Stay with C(q) = 200 + 8q + 0.05q^2, where q is units produced and C is total cost in dollars. At 40 units, total cost is $600. At 50 units, it's $725.
The rise is $125 over 10 extra units, so the average rate of change is $12.50 per unit across that gap. That's useful, but it hides the story inside the gap. It doesn't tell you whether the early units in that block were cheaper and the later ones dearer.
Shrink the Gap
Now narrow the interval. Compare 40 with 41, then 40 with 40.1, then smaller still. Each average gets closer to the slope right at 40.
The derivative is the limit of those averages as the extra quantity approaches zero. Here C'(q) = 8 + 0.1q, so C'(40) = 12. In plain English, near 40 units, total cost is climbing at about $12 for each additional unit.
Think of a car. Average speed over a whole trip can be 50 miles per hour even if you stopped for fuel. The speedometer at one moment is the local reading, and a derivative works like that speedometer, not like the trip average.
Total, average and marginal cost for C(q) = 200 + 8q + 0.05q^2
Notice what the table doesn't claim. C'(40) = 12 is not the cost of the 40th unit by itself, and it certainly isn't total cost. It's a local slope at a stated input.
Read the Sign Before the Size
Three readings cover most exam questions. Train yourself to state them in words, not symbols.
- Positive derivative: The quantity is rising at that input, so a small increase in the input pushes it up.
- Zero derivative: The graph is flat there, which makes it a candidate turning point, nothing more yet.
- Negative derivative: The quantity is falling at that input, so a small increase in the input pushes it down.
The same habit works outside business. Say approval is A(t) percent after t weeks and A'(6) = -1.5 points per week. Support is slipping at week 6. That reading doesn't say approval is low, and it doesn't say it has hit zero.
Habit to copy: Say the sign, the units and the nearby input every time. Rising or falling, per what, near where.
That one sentence prevents most early mistakes. You're no longer reporting a naked number. You're reporting a rate that a manager, policymaker or researcher can act on, or can challenge.
When a Marginal Reading Is Trustworthy
At 40 units, this firm has three different numbers that students routinely swap. Total cost is $600, from 200 + 320 + 80. Average cost is $600 divided by 40, so $15 per unit. Marginal cost is C'(40) = $12 per unit.
Those are not three names for one thing. The $200 fixed cost never appears in the derivative, because a constant doesn't change when q changes. Marginal cost therefore tells you about the next small step, while total cost still includes the bill you'd pay even at zero extra output.
Where the Reading Separates
At 100 units, total cost is $1,500, so average cost is again $15 per unit on this particular curve. Marginal cost, though, is $18 per unit. Same average, very different next step.
If your decision is about expanding from where you are, the marginal reading is the relevant one. If your decision is about whether the whole operation covers its costs, you need the total or the average. Picking the wrong one gives you a correct calculation and a wrong decision.
There's also a small lie built into every one-unit reading, and you should know its size. The actual step C(41) - C(40) is 12.05, a little above the derivative's 12, because the quadratic bends upward. For one unit here, that error is tiny. For a strongly curved function or a 50-unit jump, it isn't.
The decision rule follows directly. Produce another unit only while marginal revenue exceeds marginal cost. Stop trusting that comparison once a capacity constraint, a price break or a jump in the data makes the smooth curve a false picture of the firm.
Valid and invalid readings of a calculus result
Elasticity Removes the Units
Sometimes dollars per unit is the wrong language. A pricing team often wants a percent response, which is what elasticity gives: E = (dQ/dp)(p/Q).
If E = -1.5 at a price, a 1 percent price rise cuts quantity demanded by about 1.5 percent nearby. Because the absolute value is above 1, demand is elastic there, so raising price lowers revenue. The minus sign carries the direction, and dropping it without comment loses half the meaning.
This interpretation step is exactly where many students stall. The Springer research on first-year economics students (opens in a new tab) reports significant calculus difficulties linked to weak prior knowledge and trouble connecting derivatives with their economic interpretation, while a related study of business students found many viewed calculus as disconnected topics with one correct method, emphasizing memorization rather than understanding.
So end every marginal problem with three prompts. State the units. Say the result in plain English. Name the decision that flips if the derivative changes sign. If you can't do all three, the differentiation was only half the answer.
How to Optimize a Business or Policy Model
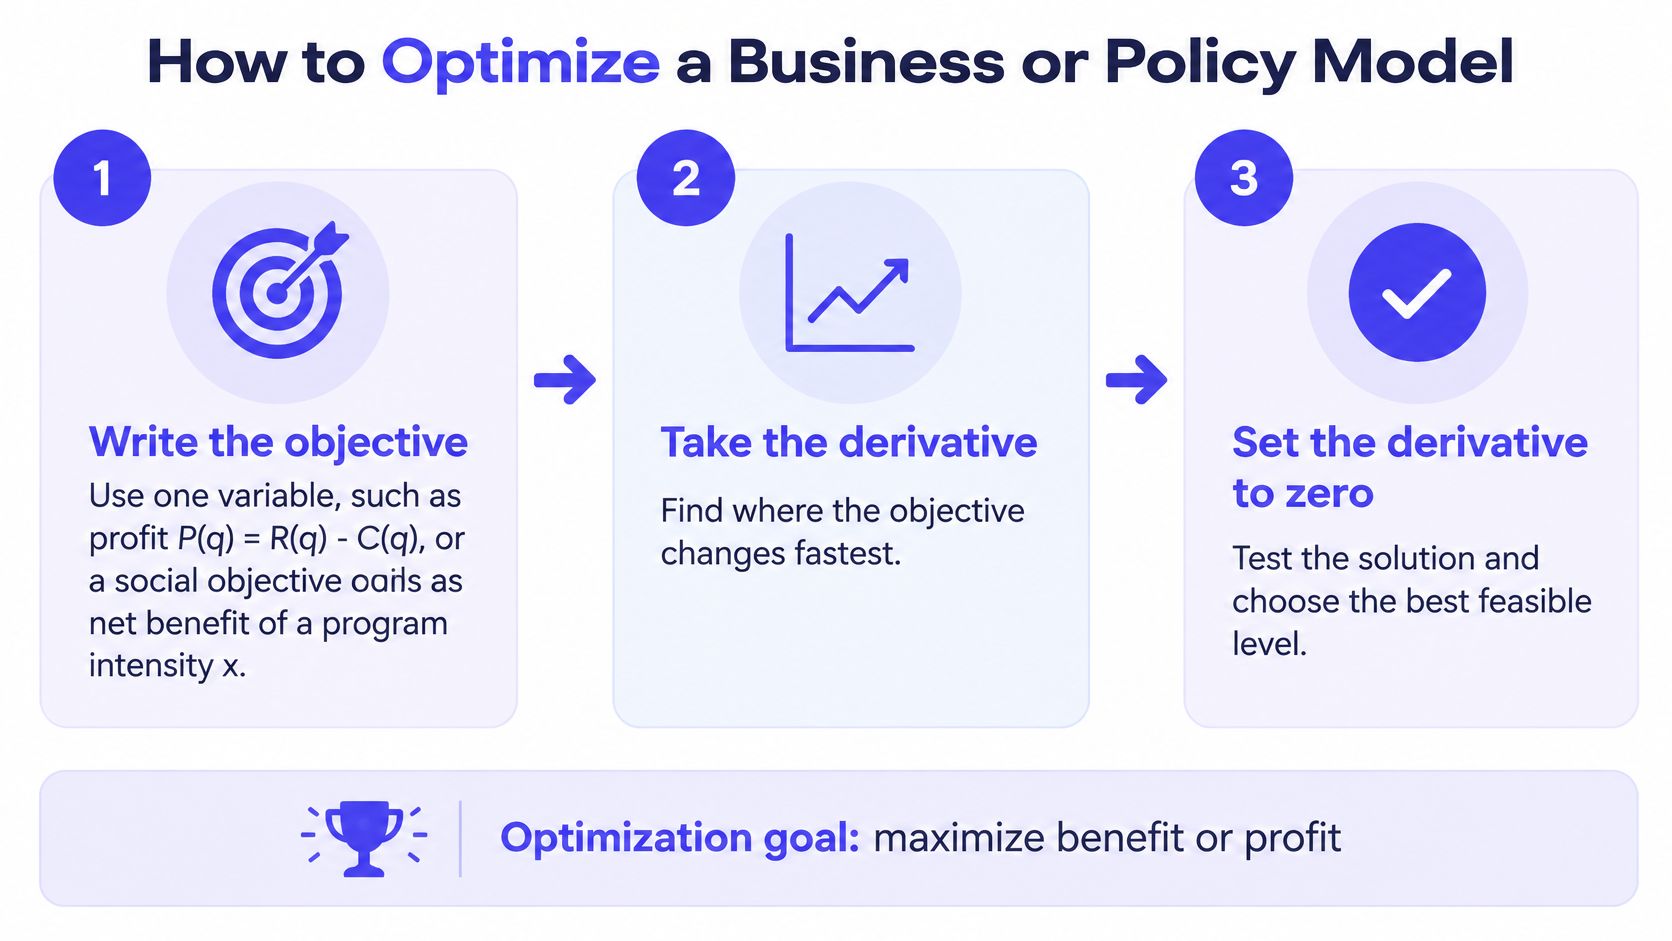
Optimization questions look varied, but the procedure doesn't change. You're looking for the input where a small step stops improving your objective. Follow the same five steps whether the objective is profit, cost or net social benefit.
The Five Steps in Order
- Write the objective in one variable: Use P(q) = R(q) - C(q) for profit, or net benefit as a function of program intensity x for a policy choice. If two variables remain, use the constraint in the question to eliminate one. 2. Differentiate and set the derivative to zero: For profit, P'(q) = 0 means marginal revenue equals marginal cost, so the next unit adds as much cost as revenue. 3. Solve and discard impossible inputs: Negative quantities, fractions of a person, and inputs outside the stated range leave the list immediately, however neatly they solve the equation.
- Test each survivor: If the second derivative is negative, you have a local maximum. If it's positive, you have a local minimum. If it's zero or messy, check the sign of the first derivative on each side instead.
- Compare with the endpoints: On a closed interval, the best feasible choice is often a boundary, such as full capacity or a budget of zero. A critical point that beats its neighbors can still lose to an endpoint.
While you're matching this procedure to your syllabus, economics resources organized by course can help you see whether your module phrases step 2 as marginal analysis or in plainer rate language.
A Short Profit Sketch
Suppose P'(q) = 40 - 2q. Setting it to zero gives q = 20, the only critical point. Since P''(q) = -2, profit is locally maximized there, provided 20 units sit inside capacity.
Now change one fact. If capacity is 15 units, q = 20 is not available, and the best feasible output is the endpoint q = 15. The algebra didn't fail. The feasible set overruled it.
A zero derivative is a candidate, not a decision. The test and the constraints turn it into one.
A social example behaves the same way. Say a campaign gains fewer extra votes from each additional dollar while its marginal cost rises. There's an interior best spend where the two marginal readings balance, but only while both curves are smooth. A legal spending cap replaces that point outright, and a minimum spend rule can do the same at the other end.
Write your final answer as a choice, not a coordinate. State the input, the objective value there, and why the endpoints lost. Markers reward that closing sentence because it proves you solved the decision, not just the equation attached to it.
Totals and Growth from a Rate
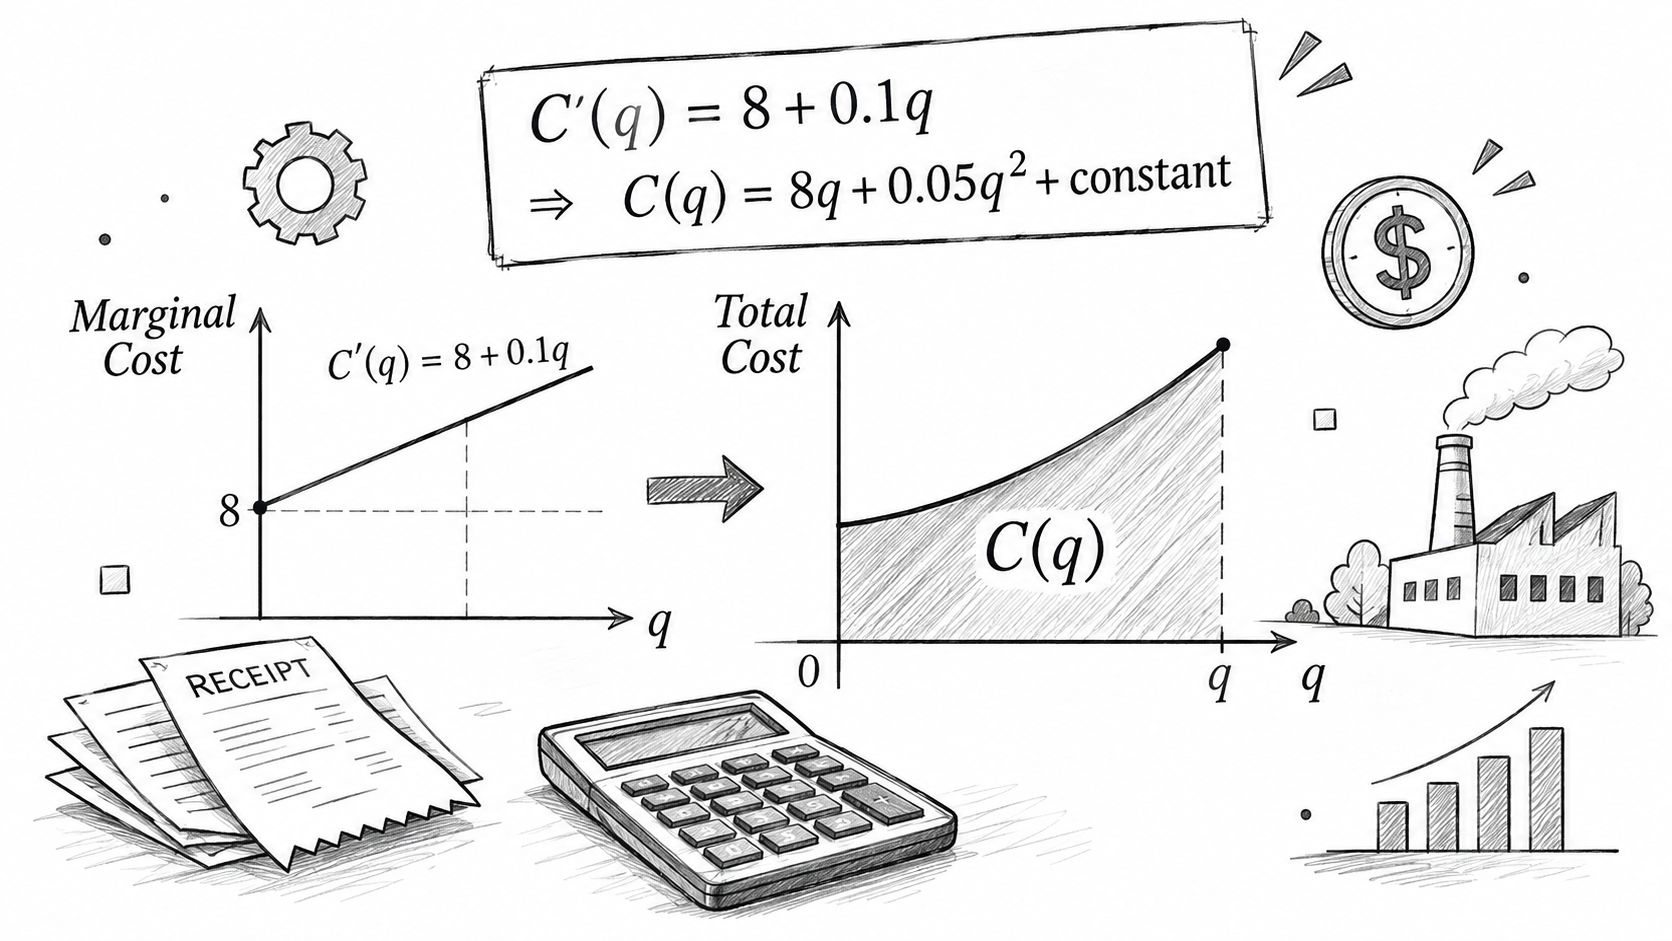
Now run the cost story backwards. You're told marginal cost is C'(q) = 8 + 0.1q and asked for total cost. Integrating gives 8q + 0.05q^2 + K, where K is a constant you cannot recover from the rate alone.
That constant is the fixed cost the derivative erased. Without a starting bill, such as C(0) = 200, the integral gives you a family of possible totals, not the firm's invoice. Students who forget K aren't making an algebra slip. They're claiming a rate can remember something it never contained.
Definite Integrals Accumulate a Block
A definite integral answers a narrower, safer question. Integrate marginal cost from 40 to 50 and you get the extra cost of that block of units, the area under the marginal cost curve between those outputs. Fixed cost cancels out, which is why block questions don't need it.
Ask the same question of any rate. Integrate a flow of new cases per week and you get total new cases over the period. Integrate a density and you get a share of a population. The units multiply out, rate times input width, and checking that product catches many setup errors before you compute anything.
Growth Turns a Rate into a Path
For continuous compounding or unrestricted growth, the model is P(t) = P0 e^{rt}. The starting stock P0 scales the whole path, so doubling P0 doubles every later value. Over short horizons, a wrong baseline does more damage than a small error in r. Over long horizons, r takes over, because it compounds.
Most social processes can't grow like that forever. Logistic growth adds a ceiling, whether that's a saturated market, a carrying capacity or 100 percent awareness of a campaign. Growth is fastest in the middle and slows near the ceiling, where the derivative approaches zero.
Read that ceiling as a limit, not a deadline. The model says growth fades as you approach it. It doesn't promise the population arrives there in five years, or at all if conditions shift.
You'll also meet a preview of partial derivatives in many modules. If sales depend on price and advertising, each partial derivative changes one input while holding the other still. That holding still is the assumption to state out loud, because real campaigns rarely move one lever at a time.
Close every accumulation or growth problem with two questions. What exactly is being accumulated, in what units? And what constant, baseline or ceiling did the model leave for you to supply?
Validate AI Work and Plan Your Module Practice
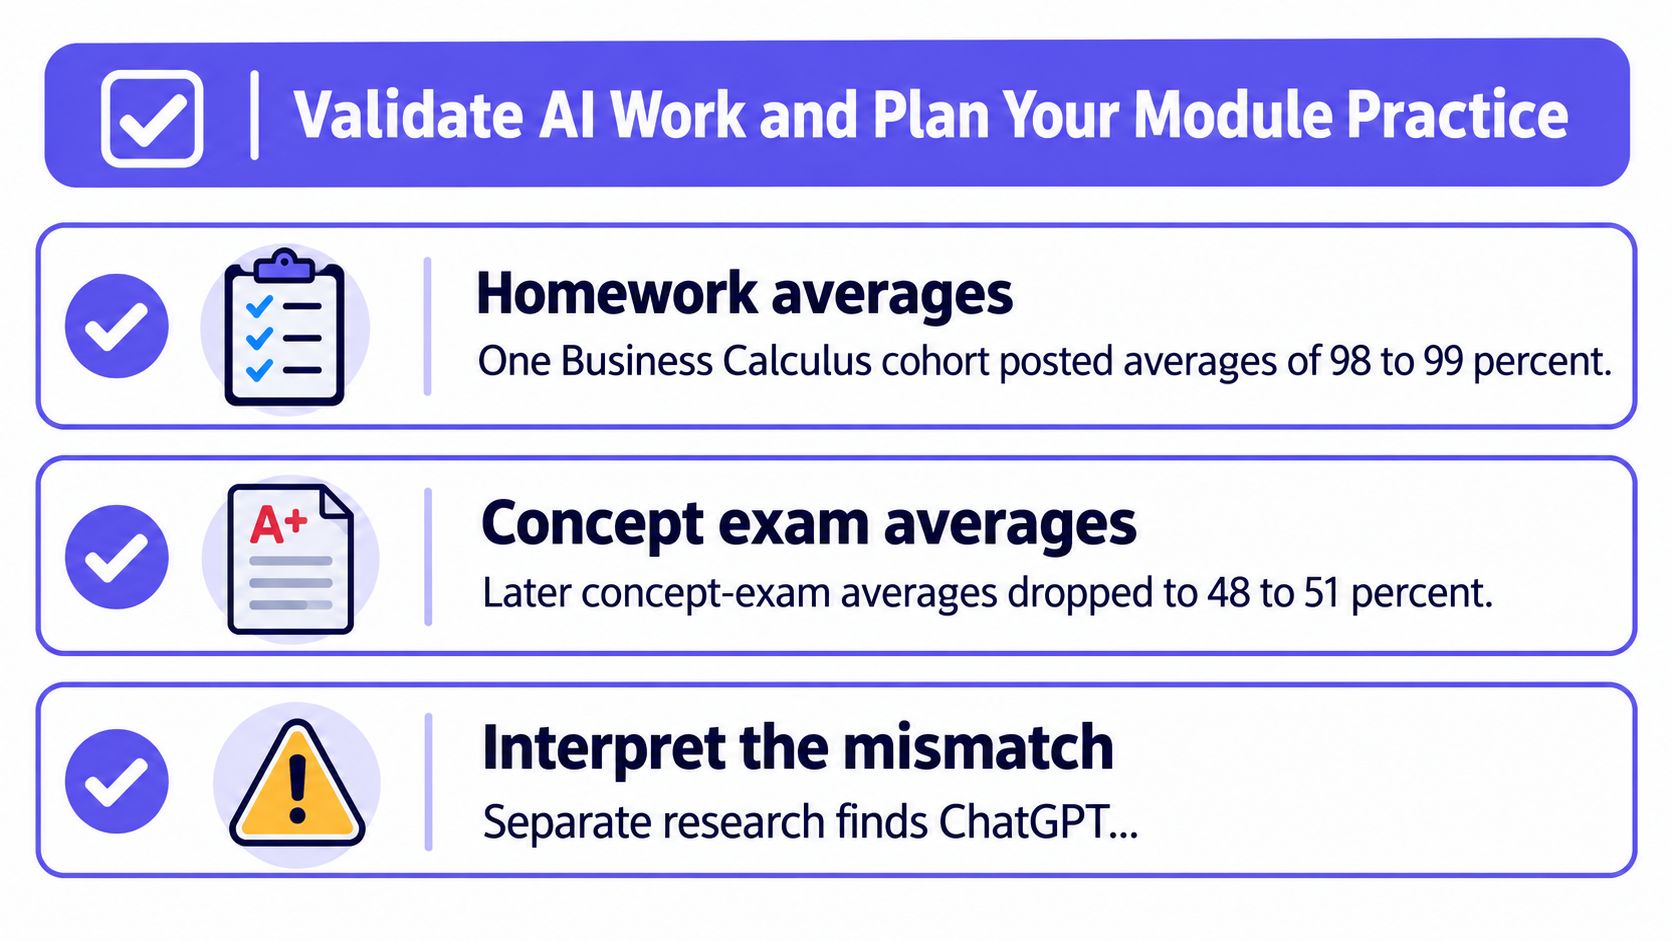
Fast homework scores can hide weak understanding. The arXiv report on Business Calculus and AI (opens in a new tab) describes homework averages of 98–99% alongside concept-oriented final-exam averages of 48–51% in a later cohort, and notes that ChatGPT is not consistently reliable on continuity, differentiability, tangent lines, derivative tests, and other conceptual or procedural tasks.
That gap isn't an argument against using AI. It's an argument against trusting it before you've done the thinking it can't do for you in an exam room.
Six Checks Before You Believe an Answer
- Predict first: Before opening any tool, write the sign and units you expect. A marginal cost in units per dollar has already failed, whatever follows.
- Ask for three representations: Request the algebra, a graph description and one plain English sentence, not a single boxed number. Wrong answers often can't keep all three consistent.
- Redo the calculus by hand: Differentiate or integrate again yourself, especially where a chain rule or a constant of integration can vanish.
- Test an endpoint and a neighbor: Plug in a boundary input and one nearby value. Many plausible answers ignore the domain or a capacity cap.
- Compare graph and sentence: If the tool says profit rises while its own derivative is negative there, stop and find which claim is wrong.
- Rewrite with the tool closed: State the decision in your own words from memory. If you can't, you haven't learned it yet, and that boundary is covered in our guide to academic integrity and honest study.
A plausible wrong answer usually has the right algebraic shape. Its units are wrong, its domain is ignored, or its critical point was never tested. Your checks are built to catch exactly those three failures.
Build Practice Around Your Own Module
Forget generic worksheets for a week. Take one live problem set from your own course and keep a one-page interpretation log with four entries per problem: function, derivative, units and decision. Rebuild two optimization problems and one integral from a blank page each week, with every tool closed.
Match the vocabulary to your module, too. Your lecturer may say marginal profit, elasticity, or rate of change of a survey share, and your log should use those exact terms. On CramShare, every document is tagged to the course, exam or textbook it was written for, searches are filtered to the exact module and academic year you're sitting, and the library holds summaries, lecture notes and past papers tagged to real course codes at real institutions, so search by course code and year rather than the broad label business calculus. Use matched notes as a complement to class for your own study only, and upload only original notes you have the right to share.
Never submit work you can't reproduce unaided, and never upload another person's exam or a publisher solution manual. Use AI to check reasoning after you've attempted the problem. That order matters.
Faster practice scores can weaken transfer when you skip verification. The explanation you write yourself is the part that survives into the exam.
Start this week with your next assignment. For each problem, fill three columns: units, plain English meaning, and the decision that changes if the sign flips. Do that before you look at any matched notes, and your calculus for business and social science practice will finally train the skill your exam is grading.
Find notes, summaries and past papers matched to your exact calculus module, course code and academic year at CramShare, then work them the way this guide suggests, with units and decisions written beside every derivative. Preview a document, check it against your own interpretation log, and keep the explaining in your own hand.