Preview Extract
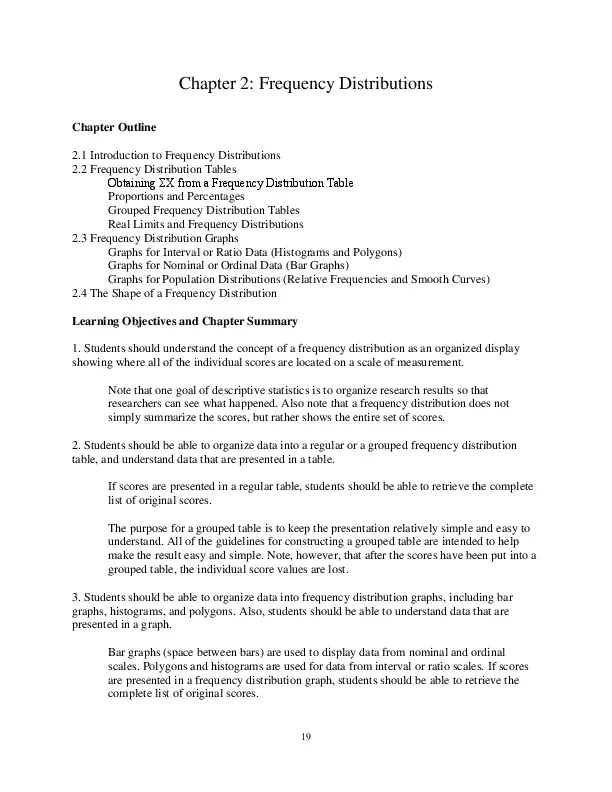
Chapter 2: Frequency Distributions
Chapter Outline
2.1 Introduction to Frequency Distributions
2.2 Frequency Distribution Tables
Obtaining ฮฃX from a Frequency Distribution Table
Proportions and Percentages
Grouped Frequency Distribution Tables
Real Limits and Frequency Distributions
2.3 Frequency Distribution Graphs
Graphs for Interval or Ratio Data (Histograms and Polygons)
Graphs for Nominal or Ordinal Data (Bar Graphs)
Graphs for Population Distributions (Relative Frequencies and Smooth Curves)
2.4 The Shape of a Frequency Distribution
Learning Objectives and Chapter Summary
1. Students should understand the concept of a frequency distribution as an organized display
showing where all of the individual scores are located on a scale of measurement.
Note that one goal of descriptive statistics is to organize research results so that
researchers can see what happened. Also note that a frequency distribution does not
simply summarize the scores, but rather shows the entire set of scores.
2. Students should be able to organize data into a regular or a grouped frequency distribution
table, and understand data that are presented in a table.
If scores are presented in a regular table, students should be able to retrieve the complete
list of original scores.
The purpose for a grouped table is to keep the presentation relatively simple and easy to
understand. All of the guidelines for constructing a grouped table are intended to help
make the result easy and simple. Note, however, that after the scores have been put into a
grouped table, the individual score values are lost.
3. Students should be able to organize data into frequency distribution graphs, including bar
graphs, histograms, and polygons. Also, students should be able to understand data that are
presented in a graph.
Bar graphs (space between bars) are used to display data from nominal and ordinal
scales. Polygons and histograms are used for data from interval or ratio scales. If scores
are presented in a frequency distribution graph, students should be able to retrieve the
complete list of original scores.
19
4. Students should understand that most population distributions are drawn as smooth curves
showing relative proportions rather than absolute frequencies.
5. Students should be able to identify the shape of a distribution shown in a frequency
distribution graph. Students should recognize symmetrical distributions (including but not
limited to normal distributions), as well as positively and negatively skewed distributions.
Other Lecture Suggestions
1. Begin with an unorganized list of scores as in Example 2.1, and then organize the scores into a
table. If you use a set of 20 or 25 scores, it will be easy to compute proportions and percentages
for the same example.
2. Present a relatively simple, regular frequency distribution table (for example, use scores of 5,
4, 3, 2, and 1 with corresponding frequencies of 1, 3, 5, 3, 2. Ask students to determine the
values of N and ฮฃX for the scores. Note that ฮฃX can be obtained two different ways: 1) by
computing and summing the fX values within the table, and 2) by retrieving the complete list of
individual scores and working outside the table.
Next, ask students to determine the value of ฮฃX2. You probably will find a lot of wrong
answers from students who are trying to use the fX values within the table. The common mistake
is to compute (fX)2 and then sum these values. Note that whenever it is necessary to do complex
calculations with a set of scores, the safe method is to retrieve the list of individual scores from
the table before you try any computations.
3. It sometimes helps to make a distinction between graphs that are being used in a formal
presentation and sketches that are used to get a quick overview of a set of data. In one case, the
graphs should be drawn precisely and the axes should be labeled clearly so that the graph can be
easily understood without any outside explanation. On the other hand, a sketch that is intended
for your own personal use can be much less precise. As an instructor, if you are expecting
precise, detailed graphs from your students, you should be sure that they know your
expectations.
20
Test Bank
MULTIPLE CHOICE
1. What is the total number of scores for the distribution shown in the following table?
a. 4
X f
b. 10
4 3
c. 14
3 5
d. 37
2 4
1 2
ANS: C
REF: 2.2
2. A sample of n = 15 scores ranges from a high of X = 11 to a low of X = 3. If these scores are
placed in a frequency distribution table, how many X values will be listed in the first column?
a. 8
b. 9
c. 10
d. It depends on whether any scores have a zero frequency.
ANS: B
REF: 2.2
3. For the following data, N = _____.
a. 10
b. 11
c. 28
d. Cannot be determined from the table
ANS: C
X f
4 2
3 4
2 3
1 2
REF: 2.2
4. For the data in the following table, what is the value of ฮฃX?
a. 10
X f
b. 15
4 1
c. 20
3 2
d. Cannot be determined from the table
2 4
1 2
ANS: C
REF: 2.2
21
5. For the scores in the following table, what is the value of ฮฃX2?
a. 30
X f
b. 41
4 1
c. 65
3 2
d. 225
2 1
1 3
ANS: B
REF: 2.2
6. For the following frequency distribution of quiz scores, how many individuals took the quiz?
a. n = 5
X f
b. n = 15
5 6
c. n = 21
4 5
d. Cannot be determined
3 5
2 3
1 2
ANS: C
REF: 2.2
7. For the following distribution of quiz scores, if a score of X = 3 or higher is needed for a passing
grade, how many individuals failed the quiz?
a. 2
X f
b. 3
5 6
c. 5
4 5
d. 10
3 5
2 3
1 2
ANS: C
REF: 2.2
8. For the following distribution of quiz scores, How many individuals had a score of X = 2?
a. 1
X f
b. 3
5 6
c. 5
4 5
d. Cannot be determined
3 5
2 3
1 2
ANS: B
REF: 2.2
22
9. For the following distribution, what percentage of the individuals have scores of X = 1?
a. 2%
X f
b. 5%
5 2
c. 10%
4 8
d. 20%
3 5
2 3
1 2
ANS: C
REF: 2.2
10. A researcher surveys a sample of n = 200 college students and asks each person to identify his or
her favorite movie from the past year. If the data were organized in a frequency distribution
table, what would be listed in the first column?
a. A list of movies
c. A list of frequencies
b. A list of students
d. None of the other options is correct
ANS: A
REF: 2.2
11. A set of scores ranges from a high of X = 72 to a low of X = 28. If these scores were put in a
grouped frequency distribution table, what would be the best choice for the interval width?
a. 2 points
c. 7 points
b. 5 points
d. 10 points
ANS: B
REF: 2.2
12. A set of scores ranges from a high of X = 24 to a low of X = 5. If these scores were put in a
frequency distribution table with an interval width of 2 points, which of the following would be
the top interval in the table?
a. 4-5
c. 24-25
b. 23-24
d. 22-24
ANS: C
REF: 2.2
13. A set of scores ranges from a high of X = 96 to a low of X = 11. If these scores were placed in a
grouped frequency distribution table, what is the best value for the interval width?
a. 5 points
c. 9 points
b. 8 points
d. 10 points
ANS: D
REF: 2.2
23
14. A biologist records the number of trout, bass, perch, and other types of fish caught in a local lake
during a 2-week period. If the results are organized in a frequency distribution table, what values
would be listed in the first column?
a. Frequencies
c. The 14 days
b. Different types of fish
d. The days of the week
ANS: B
REF: 2.2
15. For the following frequency distribution, what is ฮฃX?
a. 8
X
f
b. 90
30-34 1
c. 110
25-29 1
d. Cannot be determined 20-24 3
15-19 2
10-14 1
ANS: D
REF: 2.2
16. For the following frequency distribution of exam scores, how many students had scores higher
than X = 79?
X
f
a. 7
90-94 3
b. 12
85-89 4
c. 19
80-84 5
d. Cannot be determined
75-79 2
70-74 1
ANS: B
REF: 2.2
17. For the following frequency distribution of exam scores, what is the lowest score on the exam?
X
f
a. X = 70
90-94 3
b. X = 74
85-89 4
c. X = 90
80-84 5
d. Cannot be determined
75-79 2
70-74 1
ANS: D
REF: 2.2
24
18. For the following frequency distribution of exam scores, how many students had scores lower
than X = 80?
X
f
a. 2
90-94 3
b. 3
85-89 4
c. 7
80-84 5
d. Cannot be determined 75-79 2
70-74 1
ANS: B
REF: 2.2
19. In a grouped frequency distribution, one interval is listed as 50-59. Assuming that the scores are
measuring a continuous variable, what are the real limits for this interval?
a. 50 and 59
c. 49.5 and 59.5
b. 50.5 and 59.5
d. 49.5 and 60.5
ANS: C
REF: 2.2
20. For the following distribution, how many people had scores less than X = 19?
a. 5
X
f
b. 10
20-24 2
c. 11
15-19 5
d. Cannot be determined 10-14 4
5-9 1
ANS: D
REF: 2.2
21. For the following distribution, what is the highest score?
a. 5
X
f
b. 20
20-24 2
c. 24
15-19 5
d. Cannot be determined
10-14 4
5-9 1
ANS: D
REF: 2.2
22. For the following distribution, how many people have scores greater than X = 14?
a. 2
X
f
b. 5
20-24 2
c. 7
15-19 5
d. 11
10-14 4
5-9
1
ANS: C
REF: 2.2
25
23. For the following distribution, what is the width of each class interval?
a. 4
X
f
b. 4.5
20-24 2
c. 5
15-19 5
d. 10
10-14 4
5-9
1
ANS: C
REF: 2.2
24. If the following distribution were shown in a histogram, the width of the bar above the 15-19
interval would reach from _____ to _____.
a. X = 14.5 to X = 19.5
X
f
b. X = 15.5 to X = 18.5
20-24 2
c. X = 15.5 to X = 19.5
15-19 5
d. X = 15.0 to X = 19.0
10-14 4
5-9 1
ANS: A
REF: 2.3
25. In a frequency distribution graph, frequencies are presented on the
, and the scores
(categories) are listed on the
.
a. X axis; Y axis
c. Y axis; X axis
b. horizontal line; vertical line
d. class interval; horizontal line
ANS: C
REF: 2.3
26. Which types of graphs are used for data from an interval scale?
a. Histograms and bar graphs
c. Histograms and polygons
b. Polygons and bar graphs
d. Histograms, bar graphs, and polygons
ANS: C
REF: 2.3
27. What frequency distribution graph is appropriate for scores measured on a nominal scale?
a. Only a histogram
c. Either a histogram or a polygon
b. Only a polygon
d. Only a bar graph
ANS: D
REF: 2.3
28. If a distribution of scores is shown in a bar graph, you know that the scores were measured on
a(n) _________ scale of measurement.
a. nominal or ordinal
c. interval or ratio
b. ordinal or interval
d. discrete or continuous
ANS: A
REF: 2.3
26
29. A researcher surveys a sample of n = 200 college students and asks each person to identify his or
her favorite movie from the past year. If the results were presented in a frequency distribution
graph, what kind of graph would be appropriate?
a. A histogram
c. A histogram or a polygon
b. A polygon
d. A bar graph
ANS: D
REF: 2.3
30. A researcher collects a sample of n = 20 Introductory Psychology textbooks and records the
number of pages in each book. The results are then placed in a grouped frequency distribution
table using intervals of 0-99 pages, 100-199 pages, 200, 299 pages, and so on. If the results were
converted into a frequency distribution graph, what kind of graph should be used?
a. A bar graph
c. A polygon
b. A histogram
d. Either a histogram or a polygon
ANS: D
REF: 2.3
31. A biologist records the number of trout, bass, perch, and other types of fish caught in a local lake
during a 2-week period. If the results are organized in a frequency distribution graph, what kind
of graph should be used?
a. A bar graph
c. A polygon
b. A histogram
d. Either a histogram or a polygon
ANS: A
REF: 2.3
32. After recording the final grade (A, B, C, D, E) for each individual in a class of n = 26 students,
the professor would like to display the grade distribution in a frequency distribution graph. What
kind of graph should be used?
a. A bar graph
c. A polygon
b. A histogram
d. Either a histogram or a polygon
ANS: A
REF: 2.3
33. What kind of frequency distribution graph shows the frequencies as bars, with no space between
adjacent bars?
a. A bar graph
c. A polygon
b. A histogram
d. All of these
ANS: B
REF: 2.3
27
34. If a set of scores is displayed in a frequency distribution polygon, what scale of measurement
was used to measure the scores?
a. Nominal or ordinal
c. Ratio
b. Interval
d. Interval or ratio
ANS: D
REF: 2.3
35. A frequency distribution graph represents frequencies with vertical bars without space between
them. What scale of measurement was used to measure the scores?
a. Nominal
c. Nominal or ordinal
b. Ordinal
d. Interval or ratio
ANS: D
REF: 2.3
36. If a set of scores is displayed in a frequency distribution bar graph, what scale of measurement
was used to measure the scores?
a. Nominal
c. Nominal or ordinal
b. Ordinal
d. Interval or ratio
ANS: C
REF: 2.3
37. What kind of frequency distribution graph shows the frequencies as bars that are separated by
spaces?
a. A bar graph
c. A polygon
b. A histogram
d. All of these
ANS: A
REF: 2.3
38. How many individual scores are in the following distribution?
f
4โ โโโโโ
3โ โ
โ
2โ โ
โโโโโฌโโโโ
1โ โ
โ
โ
โโโโโฌโโโโ
โโโดโโโโดโโโโดโโโโดโโโโดโโโโดโโโ X
1
2
3
4
5
6
a. n = 5
b. n = 6
ANS: C
c. n = 10
d. cannot be determined
REF: 2.3
28
39. For the following distribution, what is ๏X?
f
4โ โโโโโ
3โ โ
โ
2โ โ
โโโโโฌโโโโ
1โ โ
โ
โ
โโโโโฌโโโโ
โโโดโโโโดโโโโดโโโโดโโโโดโโโโดโโโ X
1
2
3
4
5
6
a. ๏X = 10
b. ๏X = 15
ANS: D
c. ๏X = 21
d. ๏X = 23
REF: 2.3
40. The normal distribution is an example of
a. a histogram showing data from a sample.
b. a polygon showing data from a sample.
c. a bar graph showing data from a population.
d. a smooth curve showing data from a population.
ANS: D
REF: 2.3
41. If a set of exam scores forms a symmetrical distribution, what can you conclude about the
students scores?
a. Most of the students had relatively high scores.
b. Most of the students had relatively low scores.
c. About 50% of the students had high scores and the rest had low scores.
d. It is not possible to draw any conclusions about studentsโ scores.
ANS: C
REF: 2.4
42. If a set of exam scores forms a negatively skewed distribution, what can you conclude about the
studentsโ scores?
a. Most of the students had relatively high scores.
b. Most of the students had relatively low scores.
c. About 50% of the students had high scores and the rest had low scores.
d. It is not possible to draw any conclusions about studentsโ scores.
ANS: A
REF: 2.4
29
43. What term is used to describe the shape of a distribution in which the scores pile up on the lefthand side of the graph and taper off to the right?
a. Symmetrical
c. Negatively skewed
b. Positively skewed
d. Normal
ANS: B
REF: 2.4
44. A skewed distribution typically has _____ tail(s) and a normal distribution has ____ tail(s).
a. 1; 1
c. 2; 1
b. 1; 2
d. 2; 2
ANS: B
REF: 2.4
45. The students in a psychology class seemed to think that the midterm exam was very easy. If they
are correct, what is the most likely shape for the distribution of exam scores?
a. Symmetrical
c. Negatively skewed
b. Positively skewed
d. Normal
ANS: C
REF: 2.4
46. In a distribution with positive skew, scores with the highest frequencies are _____.
a. on the right side of the distribution
c. in the middle of the distribution
b. on the left side of the distribution
d. represented at two distinct peaks
ANS: B
REF: 2.4
47. What is the shape of the distribution for the following set of data? Scores: 1, 2, 3, 3, 4, 4, 4 5, 5,
5, 5, 6
a. Symmetrical
c. Negatively skewed
b. Positively skewed
d. Normal
ANS: C
REF: 2.4
48. What is the shape of the distribution for the following set of data?
a. Symmetrical
X f
b. Positively skewed
5 1
c. Negatively skewed
4 1
d. Normal
3 2
2 4
1 5
ANS: B
REF: 2.4
30
49. What is the shape of the distribution for the following set of data?
a. Symmetrical
X f
b. Positively skewed
5 5
c. Negatively skewed
4 3
d. Normal
3 1
2 3
1 5
ANS: A
REF: 2.4
TRUE/FALSE
1. A researcher surveys a sample of n = 200 college students and asks each person to identify his or
her favorite movie from the past year. If the data were organized in a frequency distribution
table, the first column would be a list of movies.
ANS: T
REF: 2.2
2. A group of quiz scores ranges from 3 to 10, but no student had a score of X = 5. If the scores are
put in a frequency distribution table, X = 5 would not be listed in the X column.
ANS: F
REF: 2.2
3. It is customary to list the score categories in a frequency distribution from the highest down to
the lowest.
ANS: T
REF: 2.2
4. For the distribution shown in the following table, n = 5.
X f
5
2
4
8
3
5
2
3
1
2
ANS: F
REF: 2.2
31
5. For the following distribution of scores, 20% of the individuals have scores of X = 1.
X f
5
2
4
8
3
5
2
3
1
2
ANS: F
REF: 2.2
6. For the following distribution of scores, ๏X = 18.
X f
4
1
3
2
2
3
1
2
ANS: T
REF: 2.2
7. For the following distribution of scores, ๏X2 = 92.
X f
4
1
3
2
2
3
1
2
ANS: F
REF: 2.2
8. A grouped frequency distribution table lists one interval as, 20-29. The width of this interval is 9
points.
ANS: F
REF: 2.2
9. If a distribution with more than 15 or 20 scores is being organized in a frequency distribution
table, then a grouped table should be used.
ANS: F
REF: 2.2
10. In a grouped frequency distribution table, one interval is identified as 30-34. This interval has a
width of 5 points.
ANS: T
REF: 2.2
32
11. If a set of scores covers a range of 80 points, then the grouped frequency table for the scores
should use an interval width of 8 points.
ANS: F
REF: 2.2
12. A set of scores ranges from X = 18 to X= 91. If the scores were put in a grouped frequency
distribution table with an interval width of 10 points, the top interval would be 91-100.
ANS: F
REF: 2.2
13. In a grouped frequency distribution table, the top value in each class interval should be a
multiple of the interval width.
ANS: F
REF: 2.2
14. A set of scores ranges from a low of X = 18 to a high of X = 98. If the scores are put in a
grouped frequency distribution table with an interval width of 10 points, the bottom interval
should be 10-19.
ANS: T
REF: 2.2
15. A grouped frequency distribution table does not provide enough information to obtain a
complete listing of the original set of scores.
ANS: T
REF: 2.2
16. For the following distribution, 11 people have scores greater than X = 14.
X
f
20-24 2
15-19 5
10-14 4
5-9
1
ANS: F
REF: 2.2
17. In the following distribution, the scores are grouped into class intervals that are each 5 points
wide.
X
f
20-24
2
15-19
5
10-14
4
5-9
1
ANS: T
REF: 2.2
33
18. A professor records the number of students who are absent each day for the semester. Because
this is a discrete variable, a bar graph should be used to show the frequency distribution.
ANS: F
REF: 2.3
19. If a frequency distribution is presented in a polygon, then the scores were measured on an
interval or a ratio scale.
ANS: T
REF: 2.3
20. A sports historian recorded the number of times that the New York Yankees finished 1st, 2nd, 3rd,
and so on, in their division for the past 20 years. If the results are presented in a frequency
distribution graph, then a histogram should be used.
ANS: F
REF: 2.3
21. A space is left between adjacent bars in a bar graph.
ANS: T
REF: 2.3
22. A set of scores ranging from a high of 47 to a low of 6 is organized in a grouped frequency
distribution table using an interval width of 5 points. If the distribution is shown in a graph, then
a histogram or polygon should be used.
ANS: T
REF: 2.3
23. The classrooms in the Psychology department are numbered from 100 to 108. A professor
records the number of classes held in each room during the fall semester. If the results were
presented in a frequency distribution graph, the professor should use a bar graph.
ANS: T
REF: 2.3
24. If it is appropriate to present a distribution of scores in a polygon, then it would also be
appropriate to present the scores in a bar graph.
ANS: F
REF: 2.3
25. A histogram is constructed so that adjacent bars touch.
ANS: T
REF: 2.3
26. The normal distribution is an example of a symmetrical distribution.
ANS: T
REF: 2.4
34
27. In February in New York, the daily high temperatures are typically low with only a few
relatively warm days. A frequency distribution showing the daily high temperatures would
probably form a negatively skewed distribution.
ANS: F
REF: 2.4
28. The scores for a very easy exam would probably form a positively skewed distribution.
ANS: F
REF: 2.4
29. If a set of exam scores forms a negatively skewed distribution, it suggests that the majority of the
students did not score well on the exam.
ANS: F
REF: 2.4
30. In a positively skewed distribution, the scores pile up on the left side of the distribution and taper
off to the right.
ANS: T
REF: 2.4
SHORT ANSWER
1. Find each value requested for the set of scores in the following frequency distribution table.
a. n
X f
b. ฮฃX
5 2
2
c. ฮฃX
4 2
3 3
2 5
1 2
ANS:
a. n = 14
b. ฮฃX = 39
c. ฮฃX2 = 131
REF: 2.2
2. Briefly explain what information is available in a regular frequency distribution table that is not
available in a grouped table.
ANS: A regular table identifies each individual score. However, in a grouped table, you simply
know that an individual score is located in a particular interval, but you do not know its exact
value.
REF: 2.2
35
3. For the following scores
a. construct a frequency distribution table.
b. sketch a histogram of the frequency distribution.
6, 4, 3, 5, 4, 2, 4
5, 4, 6, 1, 4, 5, 2
ANS:
a. X
6
5
4
3
2
1
f
2
3
5
1
2
1
REF: 2.2, 2.3
4. For the following scores, construct a grouped frequency distribution table using an interval width
of 10 points. Based on the table, what is the shape of the distribution?
30, 23, 58, 28, 35, 67, 74, 59, 27, 42, 46, 35
51, 33, 18, 33, 25, 38, 48, 36, 31, 39, 63, 40
ANS:
X
f
70-79 1
60-69 2
50-59 3
40-49 4
30-39 9
20-29 4
10-19 1
positively skewed
REF: 2.2, 2.4
36
Document Preview (18 of 288 Pages)
User generated content is uploaded by users for the purposes of learning and should be used following SchloarOn's honor code & terms of service.
You are viewing preview pages of the document. Purchase to get full access instantly.
-37%
Test Bank For Essentials of Statistics for the Behavioral Sciences, 8th Edition
$18.99 $29.99Save:$11.00(37%)
24/7 Live Chat
Instant Download
100% Confidential
Store
Evelyn Miller
0 (0 Reviews)
Best Selling
2023-2024 ATI Pediatrics Proctored Exam with Answers (139 Solved Questions)
$18.99 $29.99Save:$11.00(37%)
Chemistry: Principles And Reactions, 7th Edition Test Bank
$18.99 $29.99Save:$11.00(37%)
Test Bank for Hospitality Facilities Management and Design, 4th Edition
$18.99 $29.99Save:$11.00(37%)
Data Structures and Other Objects Using C++ 4th Edition Solution Manual
$18.99 $29.99Save:$11.00(37%)
Solution Manual for Designing the User Interface: Strategies for Effective Human-Computer Interaction, 6th Edition
$18.99 $29.99Save:$11.00(37%)
The World Of Customer Service, 3rd Edition Test Bank
$18.99 $29.99Save:$11.00(37%)