Preview Extract
Chapter 2 Test B
2-1
Chapter 2 Test B – Multiple Choice
Section 2.1 (Visualizing Variation in Numerical Data)
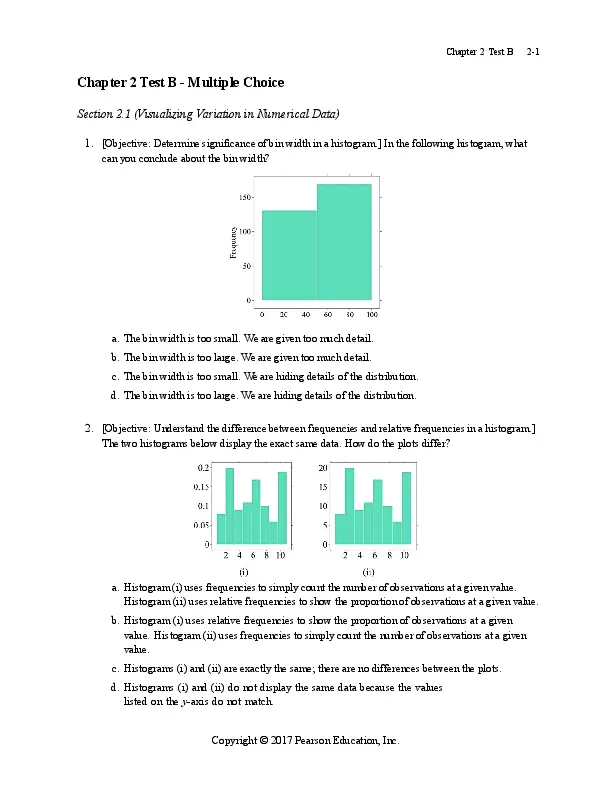
1. [Objective: Determine significance of bin width in a histogram.] In the following histogram, what
can you conclude about the bin width?
a. The bin width is too small. We are given too much detail.
b. The bin width is too large. We are given too much detail.
c. The bin width is too small. We are hiding details of the distribution.
d. The bin width is too large. We are hiding details of the distribution.
2. [Objective: Understand the difference between frequencies and relative frequencies in a histogram.]
The two histograms below display the exact same data. How do the plots differ?
a. Histogram (i) uses frequencies to simply count the number of observations at a given value.
Histogram (ii) uses relative frequencies to show the proportion of observations at a given value.
b. Histogram (i) uses relative frequencies to show the proportion of observations at a given
value. Histogram (ii) uses frequencies to simply count the number of observations at a given
value.
c. Histograms (i) and (ii) are exactly the same; there are no differences between the plots.
d. Histograms (i) and (ii) do not display the same data because the values
listed on the y-axis do not match.
Copyright ยฉ 2017 Pearson Education, Inc.
2-2
Chapter 2 Test B
3. [Objective: Understand the difference between how observations are recorded in dotplots and
stemplots.] How are individual observations recorded in a dotplot versus a stemplot?
a. A dotplot displays the actual values of observations. A stemplot uses bars to
display intervals of observations.
b. A dotplot displays the actual values of observations. A stemplot displays a dot for every
observation.
c. A dotplot displays a dot for every observation. A stemplot displays the actual values of
observations.
d. A dotplot displays a dot for every observation. A stemplot uses bars to display
intervals of observations.
4. [Objective: Understand that a distribution of a sample of data can be displayed multiple ways.]
Which dotplot represents the same data as the histogram shown below?
Copyright ยฉ 2017 Pearson Education, Inc.
Chapter 2 Test B
2-3
Section 2.2 (Summarizing Important Features of a Numerical Distribution)
5. [Objective: Know what to pay attention to in distributions of numerical data.] When examining
distributions of numerical data, what three components should you look for?
a. Shape, center, and spread
b. Shape, symmetry, and spread
c. Symmetry, skewness, and spread
d. Symmetry, center, and spread
6. [Objective: Understand modality in distributions.] Which of the following would likely show a
bimodal distribution in a histogram?
a. The midterm exam scores for an introduction to Spanish course.
b. The ages of students who attend a local high school.
c. The number of hours a college student spends on homework per night.
d. The price of college tuition, including both public and private schools.
For questions (7) – (9), match one of the histograms below with its appropriate description.
7. [Objective: Recognize the shape of a distribution.]
The distribution of test scores for a group of students who received a 15-minute study session prior to
taking a test is displayed in histogram
.
8. [Objective: Recognize the shape of a distribution.]
The distribution of male heights is displayed in histogram
.
9. [Objective: Recognize the shape of a distribution.]
The distribution of the number of โfriendsโ users of a popular social media site has is displayed in
histogram
.
Copyright ยฉ 2017 Pearson Education, Inc.
2-4
Chapter 2 Test B
10. [Objective: Understand how to find typical values from a histogram.] The following histogram
represents the movie runtimes (length of a movie in minutes) of 489 movies. What is the typical
movie runtime according to this distribution?
a. The typical value is about 90.
b. The typical value is about 100.
c. The typical value is about 120.
d. The typical value is about 130.
11. [Objective: Determine differences in variability.] Order the following histograms from most to least
variability.
a. (i), (ii), (iii)
b. (ii), (i), (iii)
c. (ii), (iii), (i)
d. (iii), (i), (ii)
Copyright ยฉ 2017 Pearson Education, Inc.
Chapter 2 Test B
2-5
12. [Objective: Interpreting typical values of bimodal distributions.] What is the typical value for the
histogram shown below?
a. The typical value is 70 because it is the average of 50 and 90.
b. The typical value is 70 because it is the center of the distribution.
c. Since the data are bimodal, a typical value cannot be found.
d. Since the data are bimodal, there are two typical values – one is about 50 and the other is about
90.
Section 2.3 (Visualizing Variation in Categorical Variables)
13. [Objective: Understand differences between bar charts and histograms.] What is the difference
between a bar chart and a histogram?
a. A bar chart represents categorical data and a histogram represents numerical data.
b. A bar chart represents numerical data and a histogram represents categorical data.
c. They can both be used to represent categorical data.
d. They can both be used to represent numerical data.
Copyright ยฉ 2017 Pearson Education, Inc.
2-6
Chapter 2 Test B
14. [Objective: Interpreting bar charts.] Which statement below is NOT supported by the following bar
chart?
a. In general, people always wear seat belts.
b. About 2000 people wear seat belts โsometimes.โ
c. More females wear seat belts compared to males.
d. More males wear seat belts compared to females.
Section 2.4 (Summarizing Categorical Distributions)
15. [Objective: Determine the variability of categorical data from a bar chart.] The bar charts below
depict the marital statuses of Americans, separated by gender. Which bar chart shows more
variability in marital status? Why?
a. The female bar chart shows more variability because many of the observations fall into one
category (โMarriedโ).
b. The female bar chart shows more variability because there are more observations in the
different categories than there are for males.
c. The male bar chart shows more variability because many of the observations fall into one
category (โMarriedโ).
d. The male bar chart shows more variability because there are more observations in the
different categories than there are for females.
Copyright ยฉ 2017 Pearson Education, Inc.
Chapter 2 Test B
2-7
16. [Objective: Understand the term mode when describing categorical variables.] What does it mean
to find the mode of a bar chart?
a. The mode can be found by finding the bar, or category, with the most observations.
b. You cannot find a mode for categorical data. Modes are only used with numerical data.
c. The mode can be found by adding up the total number of observations and dividing by the
number of categories.
d. The mode can be found by adding up the total number of categories.
Section 2.5 (Interpreting Graphs)
Use the following information to answer questions (17) – (18):
A large state university conducted a survey among their students and received 400 responses.
The survey asked the students to provide the following information:
* Age
* Year in School (Freshman, Sophomore, Junior, Senior)
* Major
17. [Objective: Determine appropriate graph based on variable type.] What type of graph would you
use to describe the variable Major?
a. A histogram because Major is a numerical variable.
b. A histogram because Major is a categorical variable.
c. A bar chart because Major is a numerical variable.
d. A bar chart because Major is a categorical variable.
18. [Objective: Determine appropriate graph based on variable type.] What type of graph would you use
to describe the variables Major and Year in School?
a. A side-by-side bar chart should be used since these are two categorical variables.
b. A side-by-side bar chart should be used since these are two numerical variables.
c. A side-by-side histogram should be used since these are two categorical variables.
d. A side-by-side histogram should be used since these are two numerical variables.
Copyright ยฉ 2017 Pearson Education, Inc.
2-8
Chapter 2 Test B
A word cloud was created using the first chapter of John Greenโs The Fault in Our Stars. (Note that filler
words such as โthe,โ โa/an,โ and โandโ were excluded from the plot.) Use the word cloud to answer
questions (19) – (20).
19. [Objective: Interpreting word clouds.] According to the word cloud, which is the most common
word in the first chapter of The Fault in Our Stars? Why?
a. The most common word is โthingโ because it appears in the middle of the cloud.
b. The most common word is โaugustusโ because he is a main character in the story.
c. The most common word is โhazelโ because that is the narratorโs name.
d. The most common word is โaugustusโ because it is the largest in size.
20. [Objective: Pitfalls of using word clouds.] What information is NOT explicitly portrayed in the
word cloud?
a. The words that occur most frequently in the chapter.
b. The number of times each word occurs.
c. The specific word that occurs most often.
Copyright ยฉ 2017 Pearson Education, Inc.
Chapter 2 Test B
Chapter 2 Test B – Answer Key
1. D
2. B
3. C
4. D
5. A
6. D
7. C
8. B
9. A
10. B
11. B
12. D
13. A
14. D
15. B
16. A
17. D
18. A
19. D
20. B
Copyright ยฉ 2017 Pearson Education, Inc.
2-9
Document Preview (9 of 217 Pages)
User generated content is uploaded by users for the purposes of learning and should be used following SchloarOn's honor code & terms of service.
You are viewing preview pages of the document. Purchase to get full access instantly.
-37%
Test Bank for Essential Statistics, 2nd Edition
$18.99 $29.99Save:$11.00(37%)
24/7 Live Chat
Instant Download
100% Confidential
Store
Alexander Robinson
0 (0 Reviews)
Best Selling
Solution Manual for Designing the User Interface: Strategies for Effective Human-Computer Interaction, 6th Edition
$18.99 $29.99Save:$11.00(37%)
Chemistry: Principles And Reactions, 7th Edition Test Bank
$18.99 $29.99Save:$11.00(37%)
Test Bank for Hospitality Facilities Management and Design, 4th Edition
$18.99 $29.99Save:$11.00(37%)
Data Structures and Other Objects Using C++ 4th Edition Solution Manual
$18.99 $29.99Save:$11.00(37%)
The World Of Customer Service, 3rd Edition Test Bank
$18.99 $29.99Save:$11.00(37%)
2023-2024 ATI Pediatrics Proctored Exam with Answers (139 Solved Questions)
$18.99 $29.99Save:$11.00(37%)