Test Bank for Basic Business Statistics, 14th Edition

Preview Extract
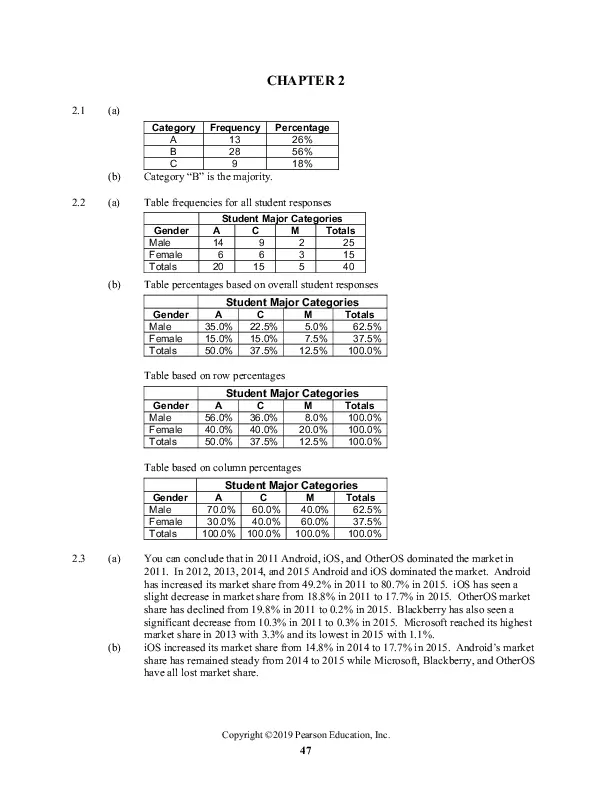
CHAPTER 2 2.1 (a) Category A B C 2.2 Frequency 13 28 9 Percentage 26% 56% 18% (b) Category โ€œBโ€ is the majority. (a) Table frequencies for all student responses Gender Male Female Totals (b) Student Major Categories A C M Totals 14 9 2 25 6 6 3 15 20 15 5 40 Table percentages based on overall student responses Student Major Categories Gender Male Female Totals A 35.0% 15.0% 50.0% C 22.5% 15.0% 37.5% M 5.0% 7.5% 12.5% Totals 62.5% 37.5% 100.0% Table based on row percentages Student Major Categories Gender Male Female Totals A 56.0% 40.0% 50.0% C 36.0% 40.0% 37.5% M 8.0% 20.0% 12.5% Totals 100.0% 100.0% 100.0% Table based on column percentages Student Major Categories Gender Male Female Totals 2.3 (a) (b) A 70.0% 30.0% 100.0% C 60.0% 40.0% 100.0% M 40.0% 60.0% 100.0% Totals 62.5% 37.5% 100.0% You can conclude that in 2011 Android, iOS, and OtherOS dominated the market in 2011. In 2012, 2013, 2014, and 2015 Android and iOS dominated the market. Android has increased its market share from 49.2% in 2011 to 80.7% in 2015. iOS has seen a slight decrease in market share from 18.8% in 2011 to 17.7% in 2015. OtherOS market share has declined from 19.8% in 2011 to 0.2% in 2015. Blackberry has also seen a significant decrease from 10.3% in 2011 to 0.3% in 2015. Microsoft reached its highest market share in 2013 with 3.3% and its lowest in 2015 with 1.1%. iOS increased its market share from 14.8% in 2014 to 17.7% in 2015. Androidโ€™s market share has remained steady from 2014 to 2015 while Microsoft, Blackberry, and OtherOS have all lost market share. Copyright ยฉ2019 Pearson Education, Inc. 47 48 2.4 Chapter 2: Organizing and Visualizing Variables (a) Category (b) Total Percentages Bank Account or Service Consumer Loan Credit Card Credit Reporting Debt Collection Mortgage Student Loan Other 202 132 175 581 486 442 75 72 9.330% 6.097% 8.083% 26.836% 22.448% 20.416% 3.464% 3.326% Grand Total 2165 There are more complaints for credit reporting, debt collection, and mortgage than the other categories. These categories account for about 70% of all the complaints. (c) (d) Company Total Percentage Bank of America Capital One Citibank Ditech Financial Equifax Experian JPMorgan Nationstar Mortgage Navient Ocwen Synchrony Trans-Union Wells Fargo 42 93 59 31 217 177 128 39 38 41 43 168 77 3.64% 8.07% 5.12% 2.69% 18.82% 15.35% 11.10% 3.38% 3.30% 3.56% 3.73% 14.57% 6.68% Grand Total 1153 Equifax, Trans-Union, and Experion, all of which are credit score companies, have the most complaints. 2.5 Executives anticipate Artificial Intelligence/Machine Learning technology to have the greatest disruptive impact on their firm in the next decade followed by Digital Technologies such as mobile, social media and IoT. They anticipate Financial Tech Solutions and Cloud computing will have some disruptive impact while Blockchain and other technologies to have little impact. 2.6 The largest sources of summer power-generating capacity in the United States are natural gas followed by coal. Nuclear, hydro, wind and other generate about the same, and solar generates very little. Copyright ยฉ2019 Pearson Education, Inc. Solutions to End-of-Section and Chapter Review Problems 2.7 (a) Technologies 2.8 49 Frequency Wearable technology Blockchain technology Artificial Intelligence Iot: retail insurance Iot: commerical insurance Social media 9 9 17 23 5 27 Grand Total 90 Percentage 10.00% 10.00% 18.89% 25.56% 5.56% 30.00% (b) Professionals expect to be using Social media and Iot: retail insurance technologies the most over the next year followed by Artificial Intelligence. Professionals do not expect to be using Wearable, Blockchain, and Iot: commercial insurance technologies much over the next year. (a) Table of row percentages: GENDER OVERLOADED Male Female Total Yes No 44.08% 53.54% 55.92% 46.46% 100.00% 100.00% Total 51.64% 48.36% 100.00% Table of column percentages: GENDER OVERLOADED Male Female Total Yes No 17.07% 82.93% 23.13% 76.87% 20.00% 80.00% Total 100.00% 100.00% 100.00% Table of total percentages: GENDER (b) OVERLOADED Male Female Total Yes No 8.82% 42.83% 11.18% 37.17% 20.00% 80.00% Total 51.64% 48.36% 100.00% Approximately the same percentages of males and females as a percentage of the total number of people surveyed feel overloaded with too much information. As percentages of those who do and do not feel overloaded, the genders differ mildly. However, four times as many people do not feel overloaded at work than those that do. Copyright ยฉ2019 Pearson Education, Inc. 50 2.9 Chapter 2: Organizing and Visualizing Variables (a) Column Percentage OUTCOME CATEGORY Successful Not Successful Film & Video Games Music Technology Total 36.02% 15.44% 40.20% 8.34% 100.00% 36.81% 18.24% 24.38% 20.56% 100.00% Total 36.51% 17.19% 30.34% 15.96% 100.00% Row Percentages OUTCOME CATEGORY Successful Not Successful Total Film & Video Games Music Technology 37.15% 33.84% 49.91% 19.69% 62.85% 66.16% 50.09% 80.31% 100.00% 100.00% 100.00% 100.00% Total 37.67% 62.33% 100.00% Total Percentages OUTCOME (b) (c) CATEGORY Successful Not Successful Film & Video Games Music Technology Total 13.57% 5.82% 15.14% 3.14% 37.67% 22.95% 11.37% 15.20% 12.82% 62.33% Total 36.51% 17.19% 30.34% 15.96% 100.00% The row percentages are most informative because they provide a percentage of successful projects within each category which allows one to compare across categories. Music kick starter projects were the most successful with approximately 50% of the projects succeeding compared to less than 20% of the Technology projects. The Film & Video and Games categories had success rates in between the Music and Technology categories, with success rates of 37% and 34% respectively. 2.10 Social recommendations had very little impact on correct recall. Those who arrived at the link from a recommendation had a correct recall of 73.07% as compared to those who arrived at the link from browsing who had a correct recall of 67.96%. 2.11 Ordered array: 63 64 68 71 75 88 94 Copyright ยฉ2019 Pearson Education, Inc. Solutions to End-of-Section and Chapter Review Problems 2.12 Ordered array: 73 78 78 78 85 88 91 2.13 (a) (b) (c) (d) 2.14 2.15 51 (166 + 100)/591 * 100 = 45.01% (124 + 77)/591 * 100 = 34.01% (59 + 65)/591 * 100 = 20.98% 45% of the incidents took fewer than 2 days and 66% of the incidents were detected in less than 8 days. 79% of the incidents were detected in less than 31 days. 216,000 ๏€ญ 61,000 ๏€ฝ 33,333.33 so choose 40,000 as interval width 6 (a) $60,000 โ€“ under $100,000; $100,000 โ€“ under $140,000; $140,000 โ€“ under $180,000; $180,000 โ€“ under $220,000; $220,000 โ€“ under $260,000; $260,000 โ€“ under $300,000 (b) $40,000 60,000 ๏€ซ 100000 ๏€ฝ 80000 similarly, the remaining class midpoints are $120,000; (c) 2 $160,000; $200,000; $240,000; $280,000 (a) 222.67 298.00 398.55 505.77 789.20 262.50 318.67 418.14 539.68 878.20 262.67 324.33 422.45 571.50 276.40 332.93 423.50 585.20 278.00 345.09 429.00 696.33 290.83 346.70 441.00 718.50 292.87 380.67 492.71 726.40 (b) NBA Cost Cost $ (c) Frequency Percentage 200 but less than 300 8 27% 300 but less than 400 7 23% 400 but less than 500 6 20% 500 but less than 600 4 13% 600 but less than 700 1 3% 700 but less than 800 3 10% 800 but less than 900 1 3% Total 30 100% 70% of the costs to attend a NBA basketball game are between $200 and $500 with 27% of the costs between $200 and $300. Three teams or 10% of the NBA teams have costs between $700 and $800. Copyright ยฉ2019 Pearson Education, Inc. 52 2.16 Chapter 2: Organizing and Visualizing Variables (a) Electricity Costs Electricity Costs Frequency Percentage $80 but less than $100 4 8% $100 but less than $120 7 14% $120 but less than $140 9 18% $140 but less than $160 13 26% $160 but less than $180 9 18% $180 but less than $200 5 10% $200 but less than $220 3 6% Frequency Percentage $ 99 4 8.00% 8.00% $119 7 14.00% 22.00% $139 9 18.00% 40.00% $159 13 26.00% 66.00% $179 9 18.00% 84.00% $199 5 10.00% 94.00% $219 3 6.00% 100.00% (b) Electricity Costs (c) 2.17 Cumulative % The majority of utility charges are clustered between $120 and $180. (a) Commuting Time (minutes) 200 but less than 230 230 but less than 260 260 but less than 290 290 but less than 320 320 but less than 350 350 but less than 380 Frequency 12 9 4 3 1 1 30 Percentage 40% 30% 13% 10% 3% 3% 100% (b) Commuting Time (minutes) 200 but less than 230 230 but less than 260 260 but less than 290 290 but less than 320 320 but less than 350 350 but less than 380 Frequency Percentage Cumulative % 40% 30% 13% 10% 3% 3% 100% 40% 70% 83% 93% 97% 100% 12 9 4 3 1 1 30 Copyright ยฉ2019 Pearson Education, Inc. Solutions to End-of-Section and Chapter Review Problems 2.17 cont. (c) 2.18 (a), (b) (c) 2.19 The majority of commuters living in or near cities spend from 200 up to 230 minutes commuting each week. 70% of commuters spend from 200 up to 260 minutes commuting each week. Credit Score Frequency Percent (%) 560 โ€“ under 580 4 0.16 0.16 580 โ€“ under 600 24 0.93 1.09 600 โ€“ under 620 68 2.65 3.74 620 โ€“ under 640 290 11.28 15.02 640 โ€“ under 660 548 21.32 36.34 660 โ€“ under 680 560 21.79 58.13 680 โ€“ under 700 507 19.73 77.86 700 โ€“ under 720 378 14.71 92.57 720 โ€“ under 740 168 6.54 99.11 740 โ€“ under 760 22 0.86 99.96 760 โ€“ under 780 1 0.04 100.00 Cumulative Percent (%) The average credit scores are concentrated between 620 and 720. (a), (b) Bin -0.00350 but less than -0.00201 -0.00200 but less than -0.00051 -0.00050 but less than 0.00099 0.00100 but less than 0.00249 0.00250 but less than 0.00399 0.004 but less than 0.00549 (c) 2.20 53 Frequency 13 26 32 20 8 1 Percentage 13.00% 26.00% 32.00% 20.00% 8.00% 1.00% Cumulative % 13.00% 39.00% 71.00% 91.00% 99.00% 100.00% Yes, the steel mill is doing a good job at meeting the requirement as there is only one steel part out of a sample of 100 that is as much as 0.005 inches longer than the specified requirement. (a), (b) Time in Seconds Frequency Percent (%) 5 โ€“ under 10 8 16% 10 โ€“ under 15 8 30% 15 โ€“ under 20 8 36% 20 โ€“ under 25 8 12% 25 โ€“ under 30 8 6% Copyright ยฉ2019 Pearson Education, Inc. 54 2.20 cont. Chapter 2: Organizing and Visualizing Variables (b) Time in Seconds (c) 2.21 Percentage Less Than 5 0 10 16 15 46 20 82 25 94 30 100 The target is being met since 82% of the calls are being answered in less than 20 seconds (a) Call Duration (seconds) 60 up to 119 120 up to 179 180 up to 239 240 up to 299 300 up to 359 360 up to 419 420 and longer Frequency 7 12 11 11 4 3 2 50 Percentage 14% 24% 22% 22% 8% 6% 4% 100% Call Duration (seconds) Frequency Percentage (b) (c) 2.22 Cumulative % 60 up to 119 7 14% 14% 120 up to 179 12 24% 38% 180 up to 239 11 22% 60% 240 up to 299 11 22% 82% 300 up to 359 4 8% 90% 360 up to 419 420 and longer 3 2 6% 4% 96% 100% 50 100% The call centerโ€™s target of call duration less than 240 seconds is only met for 60% of the calls in this data set. (a), (b) Manufacturer A: Bin Cell 6,500 but less than 7,500 7,500 but less than 8,500 8,500 but less than 9,500 9,500 but less than 10,500 10,500 but less than 11,500 Frequency 3 5 20 9 3 Percentage 7.50% 12.50% 50.00% 22.50% 7.50% Copyright ยฉ2019 Pearson Education, Inc. Cumulative Pctage. 7.50% 20.00% 70.00% 92.50% 100.00% Solutions to End-of-Section and Chapter Review Problems 2.22 cont. (a) Manufacturer B: Bin Cell 7,500 but less than 8,500 9,500 but less than 9,500 9,500 but less than 10,500 10,500 but less than 11,500 11,500 but less than 12,500 (c) 2.23 Frequency 2 8 16 9 5 Percentage 5.00% 20.00% 40.00% 22.50% 12.50% Cumulative Pctage. 5.00% 25.00% 65.00% 87.50% 100.00% Manufacturer B produces bulbs with longer lives than Manufacturer A. The cumulative percentage for Manufacturer B shows 65% of its bulbs lasted less than 10,500 hours, contrasted with 70% of Manufacturer Aโ€™s bulbs, which lasted less than 9,500 hours. None of Manufacturer Aโ€™s bulbs lasted more than 11,499 hours, but 12.5% of Manufacturer Bโ€™s bulbs lasted between 11,500 and 12,499 hours. At the same time, 7.5% of Manufacturer Aโ€™s bulbs lasted less than 7,500 hours, whereas all of Manufacturer Bโ€™s bulbs lasted at least 7,500 hours (a) (b) 55 Amount of Soft Drink 1.850 โ€“ 1.899 1.900 โ€“ 1.949 1.950 โ€“ 1.999 2.000 โ€“ 2.049 2.050 โ€“ 2.099 2.100 โ€“ 2.149 Frequency 1 5 18 19 6 1 Percentage 2% 10% 36% 38% 12% 2% Amount of Soft Drink 1.899 1.949 1.999 2.049 2.099 2.149 Frequency Less Than 1 6 24 43 49 50 Percentage Less Than 2% 12% 48% 86% 98% 100% The amount of soft drink filled in the two liter bottles is most concentrated in two intervals on either side of the two-liter mark, from 1.950 to 1.999 and from 2.000 to 2.049 liters. Almost three-fourths of the 50 bottles sampled contained between 1.950 liters and 2.049 liters. Copyright ยฉ2019 Pearson Education, Inc. 56 2.24 Chapter 2: Organizing and Visualizing Variables (a) Copyright ยฉ2019 Pearson Education, Inc. Solutions to End-of-Section and Chapter Review Problems 2.24 cont. (b) (c) 2.25 57 The Pareto chart is best for portraying these data because it not only sorts the frequencies in descending order but also provides the cumulative line on the same chart. You can conclude that searching and buying online was the highest category and the other three were equally likely. (a) Copyright ยฉ2019 Pearson Education, Inc. 58 2.25 cont. Chapter 2: Organizing and Visualizing Variables (a) (b) (c) 2.26 The Pareto diagram is better than the pie chart or the bar chart because it not only sorts the frequencies in descending order, it also provides the cumulative polygon on the same scale. From the Pareto diagram it is obvious that more than 50% of their day is spent sleeping and taking part in leisure and sports. (a) (b) 32% + 19% + 33% = 84% Copyright ยฉ2019 Pearson Education, Inc. Solutions to End-of-Section and Chapter Review Problems 2.26 cont. (c) (d) 2.27 59 The Pareto diagram is better than the pie chart because it not only sorts the frequencies in descending order, it also provides the cumulative polygon on the same scale. (a) (b) The โ€œvital fewโ€ reasons for the categories of complaints are โ€œCredit Reportingโ€, โ€œDebt Collectionโ€, and โ€œMortgageโ€ which account for 70% of the complaints. The remaining are the โ€œtrivial manyโ€ which make up 30% of the complaints. Copyright ยฉ2019 Pearson Education, Inc. 60 2.27 cont. Chapter 2: Organizing and Visualizing Variables (c) (d) The Pareto diagram is better than the pie chart and bar chart because it allows you to see which companies account for most of the complaints. Copyright ยฉ2019 Pearson Education, Inc. Solutions to End-of-Section and Chapter Review Problems (a) Bar Chart Wet cleaning Water heating Type of Use Percentage 2.28 Refrigeration Other Lighting Heating Electronics Cooling Cooking 0 0.05 0.1 0.15 0.2 Pie Chart Wet cleaning Cooking Water heating 2% 3% 10% Cooling 15% Refrigeration 10% Electronics 9% Heating 15% Other 23% Lighting 13% Copyright ยฉ2019 Pearson Education, Inc. 0.25 61 62 2.28 cont. Chapter 2: Organizing and Visualizing Variables (a) Pareto Chart 100% 90% 80% 70% 60% 50% 40% 30% 20% 10% 0% Cooking Wet cleaning Electronics Water heating Refrigeration Lighting Heating Cooling Other 100% 90% 80% 70% 60% 50% 40% 30% 20% 10% 0% Type of Use Percentage (b) (c) 2.29 The Pareto diagram is better than the pie chart and bar chart because it not only sorts the frequencies in descending order; it also provides the cumulative polygon on the same scale. Other, cooling, heating and lighting accounted for 66% of the residential electricity consumption in the United States. (a) Copyright ยฉ2019 Pearson Education, Inc. Solutions to End-of-Section and Chapter Review Problems 2.29 cont. (a) (b) 2.30 Insurance professionals expect Social Media, AI, and IOT retail insurance to be most used in the insurance industry in the coming year. (a) (b) Females are more likely to be overloaded with information. Copyright ยฉ2019 Pearson Education, Inc. 63 64 2.31 Chapter 2: Organizing and Visualizing Variables (a) (b) 2.32 Of the successful kickstarter projects, music projects make up the largest part. (a) Side-by-side Bar Chart 91 Browsing 193 No Yes 150 Recommendation 407 0 100 200 300 400 500 Copyright ยฉ2019 Pearson Education, Inc. Solutions to End-of-Section and Chapter Review Problems 2.32 cont. (b) 65 Social recommendations had very little impact on correct recall. 2.33 Stem-and-leaf of Finance Scores 5 34 6 9 7 4 9 38 2.34 Ordered array: 50 74 74 76 81 89 92 2.35 (a) (b) (c) (d) 2.36 Ordered array: 9.1 9.4 9.7 10.0 10.2 10.2 10.3 10.8 11.1 11.2 11.5 11.5 11.6 11.6 11.7 11.7 11.7 12.2 12.2 12.3 12.4 12.8 12.9 13.0 13.2 The stem-and-leaf display conveys more information than the ordered array. We can more readily determine the arrangement of the data from the stem-and-leaf display than we can from the ordered array. We can also obtain a sense of the distribution of the data from the stem-and-leaf display. The most likely gasoline purchase is between 11 and 11.7 gallons. Yes, the third row is the most frequently occurring stem in the display and it is located in the center of the distribution. (a) Stem Unit 2 3 4 5 6 7 8 2.37 100 2 6 6 8 8 9 0 2 2 3 5 5 8 0 2 2 2 3 4 9 1 4 7 9 0 2 3 9 8 (b) The results are concentrated between $220 and $490. (a) Download Speed 4.5 Upload Speed 3.0 7.1 3.8 10.3 6.0 10.8 6.2 11.2 6.4 Copyright ยฉ2019 Pearson Education, Inc. 16.7 9.1 20.8 11.1 22.7 13.2 24.0 14.3 66 2.37 cont. Chapter 2: Organizing and Visualizing Variables (b) Download Speeds: Stem unit :1 Upload Speeds: Stem unit 1 (b) (c) The stem-and-leaf display conveys more information than the ordered array. We can more readily determine the arrangement of the data from the stem-and-leaf display then we can from the ordered array. We can also obtain a sense of the distribution of the data from the stem-and-leaf display. Download speeds are concentrated around 10 mbs and Upload speeds are concentrated around 6 mbs. Copyright ยฉ2019 Pearson Education, Inc. Solutions to End-of-Section and Chapter Review Problems 2.38 67 (a) Histogram 14 Frequency 12 10 8 6 4 2 0 90 110 130 150 170 190 210 Midpoints Percentage Polygon 30% 25% 20% 15% 10% 5% 0% 70 90 110 130 150 170 190 210 230 (b) Cumulative Percentage Polygon 100% 90% 80% 70% 60% 50% 40% 30% 20% 10% 0% 79 (c) 2.39 99 119 139 159 179 199 219 239 The majority of utility charges are clustered between $120 and $180. The cost of attending a baseball game is concentrated around $65 with twelve teams at that cost. Four teams have costs of $85 and one team is has the highest cost of $115. Copyright ยฉ2019 Pearson Education, Inc. 68 Chapter 2: Organizing and Visualizing Variables 2.40 Property taxes on a $176K home seem concentrated between $700 and $2,200 and also between $3,200 and $3,700. 2.41 (a) (b) Copyright ยฉ2019 Pearson Education, Inc. Solutions to End-of-Section and Chapter Review Problems 2.41 cont. 69 (b) Cumulative Percentage Polygon of Weekly Commuting Time (c) 2.42 The majority of Americans living in cities spend an average of 280 minutes or less commuting each week. Approximately 38% spend between 210 and 230 minutes commuting each week with a small percentage commuting spending between 370 to 380 minutes commuting each week. (a) Copyright ยฉ2019 Pearson Education, Inc. 70 2.42 cont. Chapter 2: Organizing and Visualizing Variables (b) (c) 2.43 The average credit scores are concentrated between 622 and 730. (a) (b) Yes, the steel mill is doing a good job at meeting the requirement as there is only one steel part out of a sample of 100 that is as much as 0.005 inches longer than the specified requirement. Copyright ยฉ2019 Pearson Education, Inc. Solutions to End-of-Section and Chapter Review Problems 2.44 (a) Copyright ยฉ2019 Pearson Education, Inc. 71 72 2.44 cont. Chapter 2: Organizing and Visualizing Variables (b) (c) 2.45 The target is being met since 82% of the calls are being answered in less than 20 seconds. (a) Copyright ยฉ2019 Pearson Education, Inc. Solutions to End-of-Section and Chapter Review Problems 2.45 cont. 73 (a) (b) (c) The call centerโ€™s target of call duration less than 240 seconds is only met for 60% of the calls in this data set. Copyright ยฉ2019 Pearson Education, Inc. 74 2.46 Chapter 2: Organizing and Visualizing Variables (a) Copyright ยฉ2019 Pearson Education, Inc. Solutions to End-of-Section and Chapter Review Problems 2.46 cont. (b) (c) Manufacturer B produces bulbs with longer lives than Manufacturer A Copyright ยฉ2019 Pearson Education, Inc. 75 76 2.47 Chapter 2: Organizing and Visualizing Variables (a) (b) Amount of Soft Drink 1.899 1.949 1.999 2.049 2.099 2.149 (c) Frequency Less Than 1 6 24 43 49 50 Percentage Less Than 2% 12 48 86 98 100 The amount of soft drink filled in the two liter bottles is most concentrated in two intervals on either side of the two-liter mark, from 1.950 to 1.999 and from 2.000 to 2.049 liters. Almost three-fourths of the 50 bottles sampled contained between 1.950 liters and 2.049 liters. Copyright ยฉ2019 Pearson Education, Inc. Solutions to End-of-Section and Chapter Review Problems 2.48 (a) Y Scatter Plot 10 9 8 7 6 5 4 3 2 1 0 0 2 4 6 8 10 X (b) (a) (b) 2.50 Annual sales appear to be increasing until 2011 then remain flat from 2011 to 2013 followed by a decline after 2013. (a) Scatter Plot US Gross 2.49 There is no relationship between X and Y. 500 400 300 200 100 0 0 50 100 First Weekend 150 200 Copyright ยฉ2019 Pearson Education, Inc. 77 78 2.50 cont. Chapter 2: Organizing and Visualizing Variables (b) Worldwide Gross Scatter Plot 1500 1000 500 0 0 (c) 2.51 50 100 First Weekend 150 200 There appears to be a linear relationship between the first weekend gross and either the U.S. gross or the worldwide gross of Harry Potter movies. However, this relationship is greatly affected by the results of the last movie, Deathly Hallows, Part II. (a) Scatter Plot Typical Cost ($) 100 80 60 40 20 0 0 2.52 20 40 60 80 Bundle Score 100 120 (b) There appears to be a positive relationship between Bundle score and typical cost. (a) There appears to be a positive relationship between the download speed and the upload speed. (b) Copyright ยฉ2019 Pearson Education, Inc. Solutions to End-of-Section and Chapter Review Problems 2.52 cont. (c) 2.53 (a) Yes, this is borne out by the data (b) (c) There does not appear to be a relationship between GDP and social media usage. (d) There is a positive relationship between GDP and internet usage. Copyright ยฉ2019 Pearson Education, Inc. 79 80 2.54 2.55 Chapter 2: Organizing and Visualizing Variables (a) Excel output: (b) There is a great deal of variation in the returns from decade to decade. Most of the returns are between 5% and 15%. The 1950s, 1980s, and 1990s had exceptionally high returns, and only the 1930s and 2000s had negative returns. (a) (b) There is an upward trend in home sales price until 2006. Prices decline or remain flat from 2006 โ€“ 2011. From 2011 โ€“ 2016 there is an upward trend in median price of new home sales. There is a huge drop in median prices in September 2015. This should be investigated further and may be just an error in the data file. Copyright ยฉ2019 Pearson Education, Inc. Solutions to End-of-Section and Chapter Review Problems 2.56 (a) (b) 2.57 There was a decline in movie attendance from 2001 to 2016. During that time, movie attendance increased from 2001 to 2002 but then by 2016 decreased to a level below 2001. (a) Copyright ยฉ2019 Pearson Education, Inc. 81 82 2.57 cont. Chapter 2: Organizing and Visualizing Variables (a) (b) (c) 2.58 (a) (b) There does not appear to be a pattern present in the number of Ads ran between the opening kickoff and the final whistle over the years from 2006 to 2015. The total elapse run time (in minutes) of commercials increased from 2007 to 2013 followed by a declined in 2014 and 2015. Pivot Table in terms of % Count of Type Type One Two Star Rating Three Four Five Growth Large Mid-Cap Small Value Large Mid-Cap Small Grand Total 5.43% 3.76% 1.25% 0.42% 2.92% 2.09% 0.63% 0.21% 8.35% 17.12% 7.72% 5.43% 3.97% 10.65% 6.68% 2.09% 1.88% 27.77% 27.35% 13.57% 7.52% 6.26% 13.99% 9.19% 2.71% 2.09% 41.34% 11.27% 5.43% 3.13% 2.71% 7.31% 3.97% 1.04% 2.30% 18.58% 2.71% 1.67% 0.63% 0.42% 1.25% 1.25% 0.00% 0.00% 3.97% Grand Total 63.88% 32.15% 17.96% 13.78% 36.12% 23.18% 6.47% 6.48% 100.00% The growth and value funds have similar patterns in terms of star rating and type. Both growth and value funds have more funds with a rating of three. Very few funds have ratings of five. Copyright ยฉ2019 Pearson Education, Inc. Solutions to End-of-Section and Chapter Review Problems 2.58 cont. 2.59 (c) 83 Pivot Table in terms of Average Three-Year Return Count of Type Type One Two Star Rating Three Four Five Growth Large Mid-Cap Small Value Large Mid-Cap Small Grand Total 5.41 6.97 2.27 0.78 4.43 5.23 2.79 1.33 5.07 7.04 9.43 5.07 5.09 5.49 6.05 5.77 3.20 6.45 8.94 10.62 7.93 6.52 7.29 7.58 7.32 5.93 8.38 10.14 11.83 8.77 8.35 8.34 8.85 9.26 7.04 9.43 12.83 14.25 11.22 9.53 10.23 10.23 โ€“ โ€“ 12.01 (d) There are 65 large cap growth funds with a rating of three. Their average three year return is 10.62. (a) Pivot table of tallies in terms of counts: Pivot table of tallies in terms of % of grand total: Copyright ยฉ2019 Pearson Education, Inc. Grand Total 8.51 10.30 6.93 6.39 6.84 7.29 6.69 5.39 7.91 84 2.59 cont. Chapter 2: Organizing and Visualizing Variables (b) For the large-cap funds, the three-star rating category had the highest percentage of funds, followed by two-star, four-star, one-star, and five-star. Very few large-cap funds had ratings of five. This pattern was also seen with the mid-cap funds as a group. The same pattern was observed with the small-cap funds. However, the pattern was more subtle in that the differences in percentage were less in many cases. Within the large-cap fund category, the highest percentage of funds were in the averagerisk category followed by the low-risk and high-risk categories. Within the mid-cap category, the highest percentage of funds were in the average-risk category followed by the high and low risk categories. Within the small-cap category, the highest percentage of funds were in the high-risk category followed by the average and low risk categories. (c) (d) There are four high-risk large-cap funds with a three-star rating. Their average three-year return is 11.36. 2.60 (b) Count of Type Type One Two Star Rating Three Four Five Growth Large Mid-Cap Small Value Large Mid-Cap Small Grand Total 5.43% 1.25% 1.67% 2.51% 2.92% 0.84% 1.25% 0.84% 8.35% 17.12% 2.09% 7.72% 7.31% 10.65% 4.38% 4.80% 1.46% 27.77% 27.35% 4.80% 15.87% 6.68% 13.99% 7.10% 5.85% 1.04% 41.34% 11.27% 3.55% 6.05% 1.67% 7.31% 4.38% 2.71% 0.21% 18.58% 2.71% 1.46% 0.42% 0.84% 1.25% 0.84% 0.42% 0.00% 3.96% Grand Total 63.88% 13.15% 31.73% 19.00% 36.12% 17.54% 15.03% 3.55% 100.00% Patterns of star rating conditioned on risk: For the growth funds as a group, most are rated as three-star, followed by two-star, fourstar, one-star, and five-star. The pattern of star rating is different among the various risk growth funds. For the value funds as a group, most are rated as three-star, followed by two-star, fourstar, one-star and five-star. Among the high-risk value funds, more are two-star than three-star. Most of the growth funds are rated as average-risk, followed by high-risk and then lowrisk. The pattern is not the same among all the rating categories. Copyright ยฉ2019 Pearson Education, Inc. Solutions to End-of-Section and Chapter Review Problems 2.60 cont. (b) 85 Most of the value funds are rated as low-risk, followed by average-risk and then high-risk. The pattern is the same among the three-star, four-star, and five-star value funds. Among the one-star and two-star funds, there are more average risk funds than low risk funds. (c) (d) 2.61 (a) Count of Type Type One Two Star Rating Three Four Five Growth Large Mid-Cap Small Value Large Mid-Cap Small Grand Total 5.41 7.53 6.17 3.83 4.43 5.29 5.01 2.71 5.07 7.04 8.60 7.99 5.59 5.49 7.00 4.98 2.63 6.45 8.94 9.89 9.28 7.45 7.29 7.66 6.97 6.53 8.38 10.14 10.29 10.43 8.76 8.34 8.57 7.96 8.39 9.43 12.83 12.64 11.96 13.59 10.23 10.74 9.23 โ€“ 12.01 Grand Total 8.51 9.87 9.06 6.64 6.84 7.76 6.41 4.13 7.91 The three-year returns for growth funds is higher than for value funds. The return is higher for funds with higher ratings than lower ratings. This pattern holds for the growth funds for each risk level. For the low risk and average risk value funds, the return is lowest for the funds with a two-star rating. There are 32 growth funds with high risk with a rating of three. These funds have an average three-year return of 7.45. Pivot table of tallies in terms of counts: Copyright ยฉ2019 Pearson Education, Inc. 86 2.61 cont. Chapter 2: Organizing and Visualizing Variables (a) Pivot table of tallies in terms of % of grand total: (b) For growth funds, most are rated as three-star followed by two-star, four-star, one-star and five-star. Among the growth funds, large-cap and mid-cap had the same pattern of star-rating as observed for growth funds in general. Small-cap growth funds had the same pattern with the exception of having the same the number of funds rated as one-star and five-star. The pattern of star-rating is different among the various risk levels within the large-cap, mid-cap and small-cap growth funds. (c) (d) For value funds, most are rated as three-star followed by two-star, four-star, one-star, and five-star. Among the value funds, the pattern is the same for large-cap and mid-cap funds. Small-cap value funds have a different pattern. The pattern of star-rating is different among the various risk levels within the large-cap, mid-cap and small-cap funds. The tables in 2.58 through 2.60 are easier to interpret because they contain fewer fields. The table in 2.61 tallies star rating across three fields: market type, market cap, and risk level. Problems 2.58 through 2.60 tally star rating across two fields. Problem 2.60 reveals that most value funds are rated as low-risk followed by average-risk and high-risk. Problem 2.61 reveals that this is only the case among large-cap value funds. Most mid-cap value funds are rated as average-risk followed by low-risk and highrisk. Most small-cap value funds are rated as average-risk followed by high-risk and lowrisk. Problem 2.61 also reveals that among small-cap funds rated as average-risk, most are rated as four-star, followed by three-star and two-star. Because Problem 2.61 includes four fields compared to three fields included in problems 2.58 through 2.60, additional patterns can be observed. Copyright ยฉ2019 Pearson Education, Inc. Solutions to End-of-Section and Chapter Review Problems 87 2.62 The fund with the highest five-year return of 15.72 is a large cap growth fund that has a four-star rating and low risk. 2.63 (a) (b) (c) 2.64 The results from (a) reveal that the average of SD increases as the risk level increases while average of assets decreases as risk level increases. The results from (b) reveal that the average of SD is higher for growth funds compared to value funds. The patterns suggest that value funds are likely to be associated with less risk because the average of SD was lower among value funds and low risk funds. Funds 479, 471, 347, 443, and 477 have the lowest five-year return. Copyright ยฉ2019 Pearson Education, Inc. 88 2.65 Chapter 2: Organizing and Visualizing Variables (a) (b) (c) (d) For the 1-year versus 10-year return chart, the 10-year returns are much higher than the 1year returns with similar 5-year returns near 7 percent for all three market cap categories. For the 1-year versus 5-year chart, the returns are all higher for the 5-year returns compared to the 1-year returns. The 5-year returns are higher than the 10-year returns. The large-cap 5-year return is higher than the mid-cap and small 5-year returns. Because the average 5-year returns were all higher than the 10-year returns for all market cap categories, one can conclude that the returns were lower in years 6 through 10. Without annual data, one cannot conclude that this was due to consistent lower returns across the years or the result of one or two years with lower returns. Copyright ยฉ2019 Pearson Education, Inc. Solutions to End-of-Section and Chapter Review Problems 89 2.66 The five funds with the lowest five-year return have (1) midcap growth, average risk, one-star rating, (2) midcap growth, high risk, two-star rating, (3) large value, average risk, two-star rating, (4) midcap growth, high risk, one-star rating, and (5) small value, average risk, two-star rating. 2.67 (a) (b) (c) The sparklines reveal that a general trend upward in home prices during the months of February, May, November, and December and they have remained steady in September after a jump from a low in 2001. In the Time-series plot one can see an upward trend in home sales price until 2006. Prices decline or remain flat from 2006 โ€“ 2011. From 2011 โ€“ 2016 there is an upward trend in median price of new home sales. With the exception of one year, the September home prices are fairly stable. This could be an error in the data. 2.68 There has been a decline in the price of natural gas over time. However, there is no pattern within the years. For some years, the price is higher in the beginning of the year. For other years, the price is higher in the latter part of the year. Sometimes, there is little variation within the year. 2.69 Student project answers will vary 2.70 Student project answers will vary Copyright ยฉ2019 Pearson Education, Inc. 90 2.71 Chapter 2: Organizing and Visualizing Variables (a) (b) (c) There is a title. None of the axes are labeled. Copyright ยฉ2019 Pearson Education, Inc. Solutions to End-of-Section and Chapter Review Problems 2.72 (a) (b) (c) There is a title. The simplest possible visualization is not used. Copyright ยฉ2019 Pearson Education, Inc. 91 92 Chapter 2: Organizing and Visualizing Variables 2.73 (a) (b) (c) None. The use of chartjunk. 2.74 Answers will vary depending on selection of source. Copyright ยฉ2019 Pearson Education, Inc. Solutions to End-of-Section and Chapter Review Problems 2.75 (a) Exploed Pie Chart 4% 7% 7% 17% 40% 25% Online Payment Check Credit card Debit card Cash Other Cone Chart 40% 35% 30% 25% 20% 15% 10% 5% 0% Online Payment Check Credit card Debit card Copyright ยฉ2019 Pearson Education, Inc. Cash Other 93 94 2.75 cont. Chapter 2: Organizing and Visualizing Variables (a) Pyramid Chart 40% 35% 30% 25% 20% 15% 10% 5% 0% Online Payment (b) 2.76 Check Credit card Debit card Cash Other The bar chart and the pie chart should be preferred over the exploded pie chart, doughnut chart, the cone chart and the pyramid chart since the former set is simpler and easier to interpret. (a) Exploed Pie Chart 17% 10% 73% Low risk Average risk High risk Copyright ยฉ2019 Pearson Education, Inc. Solutions to End-of-Section and Chapter Review Problems 2.76 cont. 95 (a) Cone Chart 80% 70% 60% 50% 40% 30% 20% 10% 0% Low risk Average risk High risk Pyramid Chart 80% 70% 60% 50% 40% 30% 20% 10% 0% Low risk (b) Average risk High risk The bar chart and the pie chart should be preferred over the exploded pie chart, doughnut chart, the cone chart and the pyramid chart since the former set is simpler and easier to interpret. 2.77 A histogram uses bars to represent each class while a polygon uses a single point. The histogram should be used for only one group, while several polygons can be plotted on a single graph. 2.78 A summary table allows one to determine the frequency or percentage of occurrences in each category. Copyright ยฉ2019 Pearson Education, Inc. 96 Chapter 2: Organizing and Visualizing Variables 2.79 A bar chart is useful for comparing categories. A pie chart is useful when examining the portion of the whole that is in each category. A Pareto diagram is useful in focusing on the categories that make up most of the frequencies or percentages. 2.80 The bar chart for categorical data is plotted with the categories on the vertical axis and the frequencies or percentages on the horizontal axis. In addition, there is a separation between categories. The histogram is plotted with the class grouping on the horizontal axis and the frequencies or percentages on the vertical axis. This allows one to more easily determine the distribution of the data. In addition, there are no gaps between classes in the histogram. 2.81 A time-series plot is a type of scatter diagram with time on the x-axis. 2.82 Because the categories are arranged according to frequency or importance, it allows the user to focus attention on the categories that have the greatest frequency or importance. 2.83 Percentage breakdowns according to the total percentage, the row percentage, and/or the column percentage allow the interpretation of data in a two-way contingency table from several different perspectives. 2.84 A contingency table contains information on two categorical variables whereas a multidimensional table can display information on more than two categorical variables. 2.85 The multidimensional PivotTable can reveal additional patterns that cannot be seen in the contingency table. One can also change the statistic displayed and compute descriptive statistics which can add insight into the data. 2.86 In a PivotTable in Excel, double-clicking a cell drills down and causes Excel to display the underlying data in a new worksheet to enable you to then observe the data for patterns. In Excel, a slicer is a panel of clickable buttons that appears superimposed over a worksheet to enable you to work with many variables at once in a way that avoids creating an overly complex multidimensional contingency table that would be hard to comprehend and interpret. 2.87 Sparklines are compact time-series visualizations of numerical variables. Sparklines can also be used to plot time-series data using smaller time units than a time-series plot to reveal patterns that the time-series plot may not. 2.88 (a) Copyright ยฉ2019 Pearson Education, Inc. Solutions to End-of-Section and Chapter Review Problems 2.88 cont. (a) (b) Copyright ยฉ2019 Pearson Education, Inc. 97 98 Chapter 2: Organizing and Visualizing Variables 2.88 cont. (c) The publisher gets the largest portion (66.06%) of the revenue. 24.93% is editorial production manufacturing costs. The publisherโ€™s marketing accounts for the next largest share of the revenue, at 11.6%. Author and bookstore personnel each account for around 11 to 12% of the revenue, whereas the publisher and bookstore profit and income account for more than 26% of the revenue. Yes, the bookstore gets almost twice the revenue of the authors. 2.89 (a) Number of Movies Copyright ยฉ2019 Pearson Education, Inc. Solutions to End-of-Section and Chapter Review Problems 2.89 cont. (a) Copyright ยฉ2019 Pearson Education, Inc. 99 100 2.89 cont. Chapter 2: Organizing and Visualizing Variables (a) Copyright ยฉ2019 Pearson Education, Inc. Solutions to End-of-Section and Chapter Review Problems 2.89 cont. (a) Gross Copyright ยฉ2019 Pearson Education, Inc. 101 102 2.89 cont. Chapter 2: Organizing and Visualizing Variables (a) Gross Copyright ยฉ2019 Pearson Education, Inc. Solutions to End-of-Section and Chapter Review Problems 2.89 cont. (a) Tickets Sold Copyright ยฉ2019 Pearson Education, Inc. 103 104 2.89 cont. Chapter 2: Organizing and Visualizing Variables (a) Tickets Sold Copyright ยฉ2019 Pearson Education, Inc. Solutions to End-of-Section and Chapter Review Problems 2.89 cont. (a) Tickets Sold Copyright ยฉ2019 Pearson Education, Inc. 105 106 2.89 cont. Chapter 2: Organizing and Visualizing Variables (a) Tickets Sold Copyright ยฉ2019 Pearson Education, Inc. Solutions to End-of-Section and Chapter Review Problems 2.89 cont. (b) 2.90 (a) 107 Based on the Pareto chart for the number of movies, โ€œOriginal screenplayโ€, โ€œBased on real life eventsโ€ and โ€œBased on fiction/short storyโ€ are the โ€œvital fewโ€ and capture about 88% of the market share. According to the Pareto chart for gross (in $millions), โ€œOriginal screenplayโ€, โ€œBased on fiction book/short storyโ€ and โ€œBased on comic/graphic novelโ€ are the โ€œvital fewโ€ and capture about 74% of the market share. According to the Pareto chart for number of tickets sold (in millions), โ€œOriginal screenplayโ€, โ€œBased on fiction book/short storyโ€ and โ€œBased on comic/graphic novelโ€ are the โ€œvital fewโ€ and capture about 75% of the market share. Copyright ยฉ2019 Pearson Education, Inc. 108 2.90 cont. Chapter 2: Organizing and Visualizing Variables (a) (b) The pie chart or the Pareto chart would be best. The pie chart would allow you to see each category as part of the whole, while the Pareto chart would enable you to see that Small marketing/content marketing team is the dominant category. (c) Copyright ยฉ2019 Pearson Education, Inc. Solutions to End-of-Section and Chapter Review Problems 2.90 cont. (c) (d) (e) The pie chart or the Pareto chart would be best. The pie chart would allow you to see each category as part of the whole while the Pareto chart would enable you to see that very committed to content marketing is the dominant category. Most organizations have a small marketing/content marketing team and are very committed to content marketing. Copyright ยฉ2019 Pearson Education, Inc. 109 110 2.91 Chapter 2: Organizing and Visualizing Variables (a) Type of Entrรฉe % Number Se Beef 29.68% 187 Chicken 16.35% 103 Mixed 4.76% 30 Duck 3.97% 25 Fish 19.37% 122 Pasta 10.00% 63 Shellfish 11.75% 74 Veal 4.13% 26 Total 100.00% 630 (b) (c) (d) The Pareto diagram has the advantage of offering the cumulative percentage view of the categories and, hence, enables the viewer to separate the “vital few” from the “trivial many”. Beef and fish account for nearly 50% of all entrees ordered by weekend patrons of a continental restaurant. When chicken is included, nearly two-thirds of the entrees are accounted for. Copyright ยฉ2019 Pearson Education, Inc. Solutions to End-of-Section and Chapter Review Problems 2.92 111 (a) (b) (c) Dessert Ordered Yes No Total Gender Male Female 66% 34% 48% 52% 52% 48% Total 100% 100% 100% Dessert Ordered Yes No Total Gender Male Female 29% 34% 71% 52% 100% 48% Total 100% 100% 100% Dessert Ordered Yes No Total Gender Male Female 15% 8% 37% 40% 52% 48% Total 23% 77% 100% Dessert Ordered Yes No Total Gender Male Female 52% 48% 25% 75% 31% 69% Total 100% 100% 100% Dessert Ordered Yes No Total Gender Male Female 38% 16% 62% 84% 100% 100% Total 23% 77% 100% Dessert Ordered Yes No Total Gender Male Female 11.75% 10.79% 19.52% 57.94% 31.27% 68.73% Total 22.54% 77.46% 100% If the owner is interested in finding out the percentage of males and females who order dessert or the percentage of those who order a beef entrรฉe and a dessert among all patrons, the table of total percentages is most informative. If the owner is interested in the effect of gender on ordering of dessert or the effect of ordering a beef entrรฉe on the ordering of dessert, the table of column percentages will be most informative. Because dessert is usually ordered after the main entrรฉe, and the owner has no direct control over the gender of patrons, the table of row percentages is not very useful here. 29% of the men ordered desserts, compared to 17 of the women; men are almost twice as likely to order dessert as women. Almost 38% of the patrons ordering a beef entrรฉe ordered dessert, compared to 16% of patrons ordering all other entrรฉes. Patrons ordering beef are more than 2.3 times as likely to order dessert as patrons ordering any other entrรฉe. Copyright ยฉ2019 Pearson Education, Inc. 112 2.93 Chapter 2: Organizing and Visualizing Variables (a) United States Fresh Food Consumed: Copyright ยฉ2019 Pearson Education, Inc. Solutions to End-of-Section and Chapter Review Problems 2.93 cont. (a) Japan Fresh Food Consumed: Copyright ยฉ2019 Pearson Education, Inc. 113 114 2.93 cont. Chapter 2: Organizing and Visualizing Variables (a) Russia Fresh Food Consumed: Copyright ยฉ2019 Pearson Education, Inc. Solutions to End-of-Section and Chapter Review Problems 2.93 cont. (b) United States Packaged Food Consumed: Copyright ยฉ2019 Pearson Education, Inc. 115 116 2.93 cont. Chapter 2: Organizing and Visualizing Variables (b) Japan Packaged Food Consumed: Copyright ยฉ2019 Pearson Education, Inc. Solutions to End-of-Section and Chapter Review Problems 2.93 cont. (b) Russian Packaged Food Consumed: Copyright ยฉ2019 Pearson Education, Inc. 117 118 2.93 cont. Chapter 2: Organizing and Visualizing Variables (c) The fresh food consumption patterns between Japanese and Russians are quite similar with vegetables taking up the largest share followed by meats and seafood while Americans consume about the same amount of meats and seafood, and vegetables. Among the three countries, vegetables, and meats and seafood constitute more than 60% of the fresh food consumption. For Americans, dairy products, and processed, frozen, dried and chilled food and readyto-eat meals make up slightly more than 60% of the packaged food consumption. For Japanese, processed, frozen, dried and chilled food, and ready-to-eat meals, and dairy products constitute more than 60% of their packaged food consumption. For the Russians, bakery goods and dairy products take up 60% of the share of their package food consumption. 2.94 (a) Most of the complaints were against U.S. airlines. (b) Copyright ยฉ2019 Pearson Education, Inc. Solutions to End-of-Section and Chapter Review Problems 2.94 cont. (b) More of the complaints were due to flight problems. 2.95 (a) Range 0 but less than 25 25 but less than 50 50 but less than 75 75 but less than 100 100 but less than 125 125 but less than 150 150 but less than 175 Frequency 17 19 5 2 3 2 2 Percentage 34% 38% 10% 4% 6% 4% 4% Copyright ยฉ2019 Pearson Education, Inc. 119 120 2.95 cont. Chapter 2: Organizing and Visualizing Variables (b) Histogram 20 18 16 y 14 c 12 n e u 10 q e r 8 F 6 4 2 0 75 but 100 but 125 but 150 but 50 but 0 but less 25 but than 25 less than less than less than less than less than less than 175 150 125 100 75 50 Days Percentage Polygon 40% 35% 30% 25% 20% 15% 10% 5% 0% — 0.53 0.77 0.84 0.89 0.94 0.98 (c) Range 0 but less than 25 25 but less than 50 50 but less than 75 75 but less than 100 100 but less than 125 125 but less than 150 150 but less than 175 Cumulative % 34% 72% 82% 86% 92% 96% 100% Copyright ยฉ2019 Pearson Education, Inc. 1 Solutions to End-of-Section and Chapter Review Problems 2.95 cont. 121 (c) Cumulative Percentage Polygon 120% 100% 80% 60% 40% 20% 0% -0.01 (d) 2.96 24.99 49.99 74.99 99.99 124.99 149.99 174.99 You should tell the president of the company that over half of the complaints are resolved within a month, but point out that some complaints take as long as three or four months to settle. (a) Copyright ยฉ2019 Pearson Education, Inc. 122 2.96 cont. Chapter 2: Organizing and Visualizing Variables (a) Copyright ยฉ2019 Pearson Education, Inc. Solutions to End-of-Section and Chapter Review Problems 2.96 cont. (b) Copyright ยฉ2019 Pearson Education, Inc. 123 124 Chapter 2: Organizing and Visualizing Variables 2.96 (b) cont. 2.97 (c) The alcohol percentage is concentrated between 4% and 6%, with more between 4% and 5%. The calories are concentrated between 140 and 160. The carbohydrates are concentrated between 12 and 15. There are outliers in the percentage of alcohol in both tails. There are a few beers with alcohol content as high as around 11.5%. There are a few beers with calorie content as high as around 313 and carbohydrates as high as 32.1. There is a strong positive relationship between percentage of alcohol and calories and between calories and carbohydrates, and there is a moderately positive relationship between percentage alcohol and carbohydrates. (a) 0.17 0.675 1.36 2 3.04 0.3 0.68 1.41 2 3.08 0.37 0.84 1.53 2 3.2 0.44 0.995 1.6 2 3.51 0.45 1.03 1.6 2 3.75 0.57 1.08 1.66 2.5 3.9 0.57 1.15 1.7 2.52 4.35 Copyright ยฉ2019 Pearson Education, Inc. 0.6 1.2 1.7 2.6 0.6 1.29 1.78 2.7 0.62 1.32 1.8 2.87 0.64 1.339 1.98 3.025 Solutions to End-of-Section and Chapter Review Problems 2.97 cont. (b) (c) 2.98 125 Most of the states have a Cigarette Tax between $0.50 and $2. Five percent of the states have a cigarette tax of at least $3.5. (a) Copyright ยฉ2019 Pearson Education, Inc. 126 2.98 cont. Chapter 2: Organizing and Visualizing Variables (a) (b) (c) There appears to be a strong positive relationship between the yield of the one-year CD and the five-year CD. Copyright ยฉ2019 Pearson Education, Inc. Solutions to End-of-Section and Chapter Review Problems 2.99 (a) Frequency Distribution Percentage distribution (b) Copyright ยฉ2019 Pearson Education, Inc. 127 128 2.99 cont. Chapter 2: Organizing and Visualizing Variables (b) (c) Copyright ยฉ2019 Pearson Education, Inc. Solutions to End-of-Section and Chapter Review Problems 2.99 cont. (d) The majority of CEOs (54%) have a total compensation between 10 and 20 million dollars. Total compensation ranges between 1.7 and 100.1 million dollars. Total compensation for 94% of the CEOs is between 1.7 and 30 million dollars. (e) (f) 2.100 There is no relationship between the total CEO compensation and shareholder return. (a) Frequencies (Boston) Weight (Boston) 3015 but less than 3050 3050 but less than 3085 3085 but less than 3120 3120 but less than 3155 3155 but less than 3190 3190 but less than 3225 3225 but less than 3260 3260 but less than 3295 Frequency 2 44 122 131 58 7 3 1 Percentage 0.54% 11.96% 33.15% 35.60% 15.76% 1.90% 0.82% 0.27% (b) Frequencies (Vermont) Weight (Vermont) 3550 but less than 3600 3600 but less than 3650 3650 but less than 3700 3700 but less than 3750 3750 but less than 3800 3800 but less than 3850 3850 but less than 3900 Frequency 4 31 115 131 36 12 1 Percentage 1.21% 9.39% 34.85% 39.70% 10.91% 3.64% 0.30% Copyright ยฉ2019 Pearson Education, Inc. 129 130 2.100 cont. Chapter 2: Organizing and Visualizing Variables (c) (d) 0.54% of the โ€œBostonโ€ shingles pallets are underweight while 0.27% are overweight. 1.21% of the โ€œVermontโ€ shingles pallets are underweight while 3.94% are overweight. Copyright ยฉ2019 Pearson Education, Inc. Solutions to End-of-Section and Chapter Review Problems 2.101 (a) Copyright ยฉ2019 Pearson Education, Inc. 131 132 2.101 cont. Chapter 2: Organizing and Visualizing Variables (b) Copyright ยฉ2019 Pearson Education, Inc. Solutions to End-of-Section and Chapter Review Problems 2.101 cont. (b) Copyright ยฉ2019 Pearson Education, Inc. 133 134 2.101 cont. Chapter 2: Organizing and Visualizing Variables (b) Copyright ยฉ2019 Pearson Education, Inc. Solutions to End-of-Section and Chapter Review Problems 2.101 cont. (c) Copyright ยฉ2019 Pearson Education, Inc. 135 136 2.101 cont. Chapter 2: Organizing and Visualizing Variables (c) Copyright ยฉ2019 Pearson Education, Inc. Solutions to End-of-Section and Chapter Review Problems 2.101 cont. 137 (c) (d) About 90% of two-star hotels have an average room price below 164 Canadian dollars. The majority of two-star hotels have room prices between 84 and 144 Canadian dollars. Approximately 93% of three-star hotels have an average room price below 255 Canadian dollars and 90% of four-star hotels have an average room price below 295 Canadian dollars. The majority of three-star hotels have room prices between 105 and 195 Canadian dollars. The majority of four-star hotels have room prices from 145 to 235 Canadian dollars. Copyright ยฉ2019 Pearson Education, Inc. 138 2.101 cont. Chapter 2: Organizing and Visualizing Variables (e) Copyright ยฉ2019 Pearson Education, Inc. Solutions to End-of-Section and Chapter Review Problems 2.101 cont. (e) (f) 2.102 139 The relationship of the price between two-star and three-star, three-star and four-star, and two-star and four-star hotels are all positive. (a) Calories 50 up to 100 100 up to 150 150 up to 200 200 up to 250 250 up to 300 300 up to 350 350 up to 400 Frequency 3 3 9 6 3 0 1 Percentage 12% 12 36 24 12 0 4 Percentage Less Than 12% 24 60 84 96 96 100 Copyright ยฉ2019 Pearson Education, Inc. 140 2.102 cont. Chapter 2: Organizing and Visualizing Variables (b) Cholesterol 0 up to 50 50 up to 100 100 up to 150 150 up to 200 200 up to 250 250 up to 300 300 up to 350 350 up to 400 400 up to 450 450 up to 500 (c) Frequency 2 17 4 1 0 0 0 0 0 1 Percentage 8 68 16 4 0 0 0 0 0 4 Percentage Less Than 8% 76 92 96 96 96 96 96 96 100 The sampled fresh red meats, poultry, and fish vary from 98 to 397 calories per serving, with the highest concentration between 150 to 200 calories. One protein source, spareribs, with 397 calories, is more than 100 calories above the next highest caloric food. The protein content of the sampled foods varies from 16 to 33 grams, with 68% of the data values falling between 24 and 32 grams. Spareribs and fried liver are both very different from other foods sampledโ€”the former on calories and the latter on cholesterol content. Copyright ยฉ2019 Pearson Education, Inc. Solutions to End-of-Section and Chapter Review Problems 2.103 141 (a) (b) The commercial average price was highest in the summer of 2008 and has since declined. The residential average price of gasoline in the United States is higher in the summer in general. (c) (d) There appears to be a slight positive relationship between the commercial price and residential price. Copyright ยฉ2019 Pearson Education, Inc. 142 2.104 Chapter 2: Organizing and Visualizing Variables (a) Amount 2.15 2.1 2.05 2 1.95 1.9 1.85 0 (b) (c) (d) 2.105 10 20 30 40 50 60 There is a downward trend in the amount filled. The amount filled in the next bottle will most likely be below 1.894 liter. The scatter plot of the amount of soft drink filled against time reveals the trend of the data, whereas a histogram only provides information on the distribution of the data. (a) Copyright ยฉ2019 Pearson Education, Inc. Solutions to End-of-Section and Chapter Review Problems 2.105 cont. 143 (a) (b) (c) The Japanese yen had depreciated against the U.S. dollar since 1982 while the Canadian dollar appreciated gradually from 1980 to 1987 and from 1991 to 2002 and then started to depreciate until 2011. The English pound to U.S. dollarโ€™s exchange rate has been quite stable since 1983. The U.S. dollar has appreciated against the Japanese yen since 1980 and appreciated against the Canadian dollar since 2002 in general while the exchange rate against the English bound has been stable in general. Copyright ยฉ2019 Pearson Education, Inc. 2.105 cont. Chapter 2: Organizing and Visualizing Variables (c) Scatterplot of Canadian$ vs Yen 1.6 1.5 1.4 Canadian$ 144 1.3 1.2 1.1 1.0 0.9 100 150 200 Yen Copyright ยฉ2019 Pearson Education, Inc. 250 Solutions to End-of-Section and Chapter Review Problems 2.105 cont. (c) (e) 2.106 145 There is not any obvious relationship between the Canadian dollar and Japanese yen in terms of the U.S. dollar nor any relationship between the Japanese yen and English pound. There is a slightly positive relationship between the Canadian dollar and English pound which reflects the fact that when the Canadian dollar appreciated against the U.S. dollar, so did the English pound. (a) Variations Original Call to Action Button New Call to Action Button Percentage of Download 9.64% 13.64% Copyright ยฉ2019 Pearson Education, Inc. (b) Bar Chart Original Call to Action Button (c) 16.00% 14.00% 12.00% 10.00% 8.00% 6.00% 4.00% 2.00% New Call to Action Button 0.00% 2.106 cont. Chapter 2: Organizing and Visualizing Variables Variations 146 The New Call to Action Button has a higher percentage of downloads at 13.64% when compared to the Original Call to Action Button with a 9.64% of downloads. (d) Variations Original web design New web design Percentage of Downloads 8.90% 9.41% Copyright ยฉ2019 Pearson Education, Inc. Solutions to End-of-Section and Chapter Review Problems 2.106 cont. 147 (e) Bar Chart Variations Original web design New web design 0.00% (f) (g) 2.00% 4.00% 6.00% 8.00% 10.00% The New web design has only a slightly higher percentage of downloads at 9.41% when compared to the Original web design with an 8.90% of downloads. The New web design is only slightly more successful than the Original web design while the New Call to Action Button is much more successful than the Original Call to Action Button with about 41% higher percentage of downloads. (h) Call to Action Button Old New Old New (i) (j) Web Design Old Old New New Percentage of Downloads 8.30% 13.70% 9.50% 17.00% The combination of the New Call to Action Button and the New web design results in slightly more than twice as high a percentage of downloads than the combination of the Old Call to Action Button and Old web design. The New web design is only slightly more successful than the Original web design while the New Call to Action Button is much more successful than the Original Call to Action Button with about 41% higher percentage of downloads. However, the combination of the New Call to Action Button and New web design results in more than twice as high a percentage of downloads than the combination of the Old Call to Action Button and Old web design. 2.107 Class project โ€“ answers will vary depending on student responses. 2.108 Class project โ€“ answers will vary depending on student responses. Copyright ยฉ2019 Pearson Education, Inc. 148 2.109 Chapter 2: Organizing and Visualizing Variables A descriptive analysis of the weight of the pallets of the Boston shingles revealed that the average weight was 3124.2 pounds with a standard deviation of 34.7. The average weight of 3124.2 pounds was 74.2 pounds above the expected minimum weight of 3,050 pounds. An analysis of the Vermont shingles revealed that the average weight was 3704.0 pounds with a standard deviation of 46.7. The average weight of 3704.0 pounds was 104 pounds above the expected minimum weight of 3,600 pounds. The below table includes a number of descriptive statistics for the two shingle types. A frequency distribution of the Boston shingles revealed that 0.54% of the pallets were underweight and 0.27% were overweight. A frequency distribution of the Vermont shingles revealed that 1.21% of the shingles were underweight and 3.94% were overweight. The complete results are provided in the below frequency distributions. Histogram graphs of the Boston shingles and the Vermont shingles, shown below, revealed that the weights of the pallets appeared to be consistent with a normal distribution. In both cases, there was slight right skewness with the Boston shingles having slightly more right skewness than the Vermont shingles. Copyright ยฉ2019 Pearson Education, Inc. Solutions to End-of-Section and Chapter Review Problems 2.109 cont. The results of the above analyses reveal that both shingle types generally met pallet weight expectations with less than 1% of the Boston shingles weighing outside of the expected parameters and just over 5% of the Vermont shingles weighing outside of the expected parameters. The results suggest that the manufacturer should consider implementation of parameter compliance strategies for the Vermont shingles. Copyright ยฉ2019 Pearson Education, Inc. 149

Document Preview (103 of 1396 Pages)

User generated content is uploaded by users for the purposes of learning and should be used following SchloarOn's honor code & terms of service.
You are viewing preview pages of the document. Purchase to get full access instantly.

Shop by Category See All


Shopping Cart (0)

Your bag is empty

Don't miss out on great deals! Start shopping or Sign in to view products added.

Shop What's New Sign in