Solution Manual For Wardlaw's Contemporary Nutrition, 11th Edition

Preview Extract
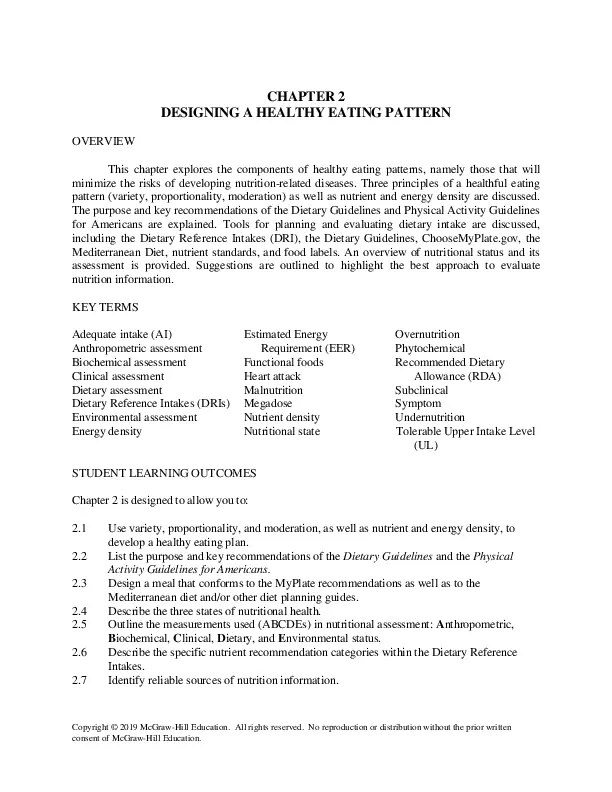
CHAPTER 2 DESIGNING A HEALTHY EATING PATTERN OVERVIEW This chapter explores the components of healthy eating patterns, namely those that will minimize the risks of developing nutrition-related diseases. Three principles of a healthful eating pattern (variety, proportionality, moderation) as well as nutrient and energy density are discussed. The purpose and key recommendations of the Dietary Guidelines and Physical Activity Guidelines for Americans are explained. Tools for planning and evaluating dietary intake are discussed, including the Dietary Reference Intakes (DRI), the Dietary Guidelines, ChooseMyPlate.gov, the Mediterranean Diet, nutrient standards, and food labels. An overview of nutritional status and its assessment is provided. Suggestions are outlined to highlight the best approach to evaluate nutrition information. KEY TERMS Adequate intake (AI) Anthropometric assessment Biochemical assessment Clinical assessment Dietary assessment Dietary Reference Intakes (DRIs) Environmental assessment Energy density Estimated Energy Requirement (EER) Functional foods Heart attack Malnutrition Megadose Nutrient density Nutritional state Overnutrition Phytochemical Recommended Dietary Allowance (RDA) Subclinical Symptom Undernutrition Tolerable Upper Intake Level (UL) STUDENT LEARNING OUTCOMES Chapter 2 is designed to allow you to: 2.1 2.2 2.3 2.4 2.5 2.6 2.7 Use variety, proportionality, and moderation, as well as nutrient and energy density, to develop a healthy eating plan. List the purpose and key recommendations of the Dietary Guidelines and the Physical Activity Guidelines for Americans. Design a meal that conforms to the MyPlate recommendations as well as to the Mediterranean diet and/or other diet planning guides. Describe the three states of nutritional health. Outline the measurements used (ABCDEs) in nutritional assessment: Anthropometric, Biochemical, Clinical, Dietary, and Environmental status. Describe the specific nutrient recommendation categories within the Dietary Reference Intakes. Identify reliable sources of nutrition information. Copyright ยฉ 2019 McGraw-Hill Education. All rights reserved. No reproduction or distribution without the prior written consent of McGraw-Hill Education. 2.8 Describe the components of the Nutrition Facts panel and the various health claims and label descriptors that are allowed. LECTURE OUTLINE 2.1 A Food Philosophy That Works A. Overview 1. Consume a variety of foods balanced by a moderate intake of each food. 2. Principles of variety, moderation, and proportionality B. Variety means eating many different foods 1. Choose foods from all the food groups and subgroups. 2. Use MyPlate as a guide. a. Vegetables b. Fruit c. Grains d. Protein e. Dairy 3. No single food meets all nutrient needs. 4. Various phytochemicals are present in fruits and vegetables. a. Provide health benefits beyond nutrient needs. b. Some phytochemicals can reduce the risk of disease. c. Table 2-1 provides tips for boosting the phytochemical content of the eating pattern. 5. Functional foods provide health benefits beyond those supplied by the traditional nutrients that the food contains. C. Proportionality means eating more nutrient-dense foods 1. Proportionality is also referred to as balance. a. Increased intake of nutrient-dense foods (fruits, vegetables, whole grains, low-fat dairy products). b. Decreased intake of foods that are high in certain fats, sugars, cholesterol, salt, and alcohol. c. Match calorie intake with energy expenditure to achieve or maintain a healthy weight. 2. Nutrient density is the ratio of the amount of one or more nutrients (e.g., protein, vitamins, and minerals) in a food relative to the calorie content of the food. a. Figure 2-1 illustrates how to choose more nutrient dense foods. b. Menu planning should focus on the total diet: overall, choose more nutrient-dense foods and fewer empty-calorie foods. c. Nutrient density is particularly important for those who consume few calories (e.g., on a weight-loss diet, children, older adults). D. Moderation refers mostly to portion size 1. Donโ€™t overconsume a specific nutrient. 2. Moderate intake of fat, sugars, salt, alcohol, and calories. 3. Energy density: compare the calorie content with the weight of the food. a. High energy density foods include nuts, fried food, cookies. Copyright ยฉ 2019 McGraw-Hill Education. All rights reserved. No reproduction or distribution without the prior written consent of McGraw-Hill Education. b. Low energy density foods contain high amounts of water and fiber (e.g., fruits and vegetables) and promote satiety without high calorie content. c. People tend to consume fewer calories when eating low energy dense foods. d. Table 2-2 presents the energy density of common foods. e. Foods can be nutrient dense and energy dense at the same time. 2.2 Dietary and Physical Activity Guidelines A. Dietary Guidelinesโ€”the basis for meal planning 1. Designed to inform the development of food, nutrition, and health policies and programs. 2. Five foundational guidelines of the 2015โ€“2020 Dietary Guidelines a. Follow a healthy eating pattern across the lifespan. b. Focus on variety, nutrient density, and amount. c. Limit calories from added sugars and saturated fats and reduce sodium intake. d. Shift to healthier food and beverage choices. e. Support healthy eating patterns for all. 3. Figure 2-2 shows Key Recommendations that accompany the Dietary Guidelines and further details healthy eating patterns. 4. Healthy eating patterns are the hallmark of the 2015โ€“2020 Dietary Guidelines. a. Goal: support healthy weight and reduce the risk of chronic disease. b. Follow Healthy U.S.-Style Eating Pattern (see Table 2-5). c. American eating patterns are low in vegetables, fruits, total grains, dairy, protein foods, and oil; intake is added sugars, saturated fats, and sodium (see Figure 2-3). 5. Meeting nutrient needs within calorie limits could alleviate many chronic diseases. 6. Figure 2-4 shows estimated daily calorie (kcal) needs based on age and activity level. 7. Nutritional needs should be met primarily from foods. 8. Increase intake of vegetables, fruits, whole grains, fat-free or low-fat dairy, seafood, lean meats and poultry, eggs, beans and peas, nuts and seeds, and oils. a. Contribute to nutrient adequacy b. Lower intake of problem nutrients c. Improve gastrointestinal function d. Aid in weight management e. Decrease the risk of chronic diseases 9. Limit intake of added sugars (less than 10% total kcal/day), saturated fat (less than 10% kcal/day), trans fats, and sodium (less than 2300mg/day). 10. Table 2-3 provides the examples of recommended changes to the eating pattern based on Dietary Guidelines. B. Physical Activity Guidelines for Americans (see Table 2-4) 1. Regular physical activity produces long-term health benefits 2. Guidelines for children (6+) and adolescents a. โ‰ฅ 60 minutes of physical activity per day Copyright ยฉ 2019 McGraw-Hill Education. All rights reserved. No reproduction or distribution without the prior written consent of McGraw-Hill Education. b. Include aerobic and muscle-strengthening and bone-strengthening exercises. c. Activities that are appropriate for age, enjoyable, and offer variety. 3. Guidelines for adults a. Avoid inactivity. b. โ‰ฅ 150 minutes per week of moderate-intensity or โ‰ฅ 75 minutes per week of vigorous-intensity physical activity. c. Include muscle-strengthening activities 2 or more days per week. 4. Guidelines for safe physical activity a. Understand the risks and choose appropriate activities for fitness level and health goals. b. Use appropriate gear and exercise in safe environments c. Consult with health care provider if there are chronic conditions and symptoms 2.3 MyPlateโ€”A Menu-Planning Tool A. Overview 1. MyPlate was released in 2011 and is a visual depiction of healthy eating for Americans. 2. MyPlate shapes Dietary Guideline recommendations into a visual place setting (see Figure 2-5). B. Dishing up MyPlate 1. MyPlate provides a visual representation of a healthy plate at mealtimes. 2. The MyPlate icon emphasizes five food groups. a. Fruits and vegetables cover half of the plate. b. Grains cover slightly more than one-fourth of the plate; half of your grain intake should be from whole grain products. c. Protein covers the remaining portion of the plate; emphasize variety of protein foods including seafood, lean meats and poultry, eggs, legumes, (beans and peas), nuts, seeds, and soy products. d. Dairy appears as a cup next to the plate; consume 2 to 3 cups of fat-free or low-fat dairy products or other rich sources of calcium. e. There is no separate group for fats or oils; limit solid fats and emphasize oils. C. Build a healthy eating style 1. All food and beverage choices matterโ€”focus on variety, amount, and nutrition 2. Choose an eating style low in saturated fat, sodium, and added sugars 3. Make small changes to create a healthier eating style a. Each change is a personal โ€œwin,โ€ and each MyWin is a change to build a healthy eating style. b. Start with a few small changes 4. Support healthy eating for everyone D. MyPlate daily checklist 1. ChooseMyPlate.gov features an interactive tool, MyPlate Daily Checklist, for individuals to estimate their calorie needs and suggests a food pattern based on age, gender, height, and weight. Copyright ยฉ 2019 McGraw-Hill Education. All rights reserved. No reproduction or distribution without the prior written consent of McGraw-Hill Education. 2. Table 2-5 presents the Healthy U.S.-Style Eating Pattern: recommended amounts of food from each MyPlate food group at 12 kcal levels. 3. Helpful visual aids for estimating servings sizes are illustrated in Figure 2-6. 4. MyPlate sets the limits for empty calories; MyPlate Daily checklists allow for some empty calories throughout the day (usually 120-160 kcal per day). E. Additional MyPlate resources 1. USDAโ€™s Ten Tips Nutrition Education series 2. Whatโ€™s Cooking? USDA Mixing bowl โ€“ help with meal planning, cooking, and grocery shopping 3. Food-A-Pedia 4. SuperTracker F. Menu planning with MyPlate (see Table 2-7) 1. MyPlate guidelines are not intended for infants or children under 2 years of age. 2. Variety is key, as each food will provide different nutrients and each food group is important (see Table 2-6). 3. There can be variation in the amount of nutrients and calorie content of foods within each food group. 4. Choosing fat-free or low-fat dairy options allows for greater amounts of foods from other groups in your daily plan. 5. Plant foods can be good sources of protein. 6. Focus on colorful fruits and vegetables to increase the nutritional quality of these choices. 7. Choose whole grain products instead of refined grains. 8. Include healthy oils from plants and fish as part of your weekly dietary pattern. G. Limitations of MyPlate 1. The MyPlate icon does not provide information about overall calories, serving sizes, or number of servings. 2. The MyPlate icon does not address types of food choices to make within each food group. 3. The MyPlate icon does not address total diet, which includes foods eaten between meals. 4. Public health campaign may not reach all of its intended audience. H. How does your plate rate? 1. Use SuperTracker tool to compare your overall intake to your personalized daily food plan. 2. Use NutritionCalc software to compare your intakes to the DRIs. I. The Mediterranean Diet Pyramid (see Figure 2-8) 1. Useful alternative to MyPlate 2. The 2015โ€“2020 Dietary Guidelines includes the Healthy Mediterranean-Style Eating Pattern. 3. Dietary pattern is linked to low rates of chronic disease and increased life expectancy. 4. Emphasizes minimally processed, plant-based foods at each meal 5. Emphasizes healthy fats (e.g., olive oil, avocado, nuts) and limits saturated fats 6. Fish and seafood consumed 2x/week 7. Encourages 5โ€“10 servings of fruits and vegetables each day Copyright ยฉ 2019 McGraw-Hill Education. All rights reserved. No reproduction or distribution without the prior written consent of McGraw-Hill Education. 8. Choose plant proteins more often and moderate intake of lean proteins and lowfat dairy products. 9. Red meats and sweet desserts are consumed less often 10. Includes regular physical activity 11. Incorporates moderate wine consumption 12. Water is the beverage of choice. 2.4 States of Nutritional Health (see Figure 2-9) A. Desirable nutrition 1. Body tissues have enough of a nutrient to support normal metabolic function. 2. Surplus of nutrients can be used in times of need. B. Undernutrition 1. Form of malnutrition in which nutrient intake does not meet nutrient needs. 2. When nutrient levels fall sufficiently low, health declines and biochemical evidence appears. 3. Subclinical deficiency shows no outward signs to reflect low nutrient levels and slow metabolic processes. 4. Clinical deficiency develops within months or years of the undernutrition; clinical symptoms often evident in skin, hair, tongue, or eyes. C. Overnutrition 1. Form of malnutrition characterized by prolonged consumption of more nutrients than the body needs 2. Example: too much vitamin A can have negative effects during pregnancy 3. Excess calorie intake is most common in developed nations. 4. The difference between desirable and overnutrition is usually large, but is the smallest for vitamin A, calcium, iron, and copper. 2.5 Measuring Your Nutritional State A. Analyzing background factors 1. Family health history 2. Medical history 3. Medication list 4. Social history 5. Education level 6. Economic status B. Assessing nutritional status using the ABCDEs (see Table 2-8 and Figure 2-10) 1. Anthropometric assessment: height, weight, body composition, circumferences. 2. Biochemical assessment: measuring nutrients or by-products in the blood and other body fluids. 3. Clinical assessment: looking for physical evidence (e.g., high blood pressure). 4. Dietary assessment: examining dietary intake. 5. Environmental assessment (from background analysis). C. Recognizing the limitations of nutritional assessment 1. Clinical symptoms of nutrient status may take years to develop. 2. Many clinical symptoms are not specific to only a nutrient deficiency. D. Concern about the state of your nutritional health is important Copyright ยฉ 2019 McGraw-Hill Education. All rights reserved. No reproduction or distribution without the prior written consent of McGraw-Hill Education. 1. Maintaining nutritional health can lead to a long and vigorous life. 2. Maintaining nutritional health can reduce disease risk. 2.6 Specific Nutrient Standards and Recommendations A. Overview 1. Dietary Reference Intakes (DRI) is the umbrella term that describes four standards for nutrient needs. 2. Table 2-9 explains the usage of the DRIโ€™s and Daily Value. B. Recommended Dietary Allowances (RDA) 1. Amount of a nutrient that meets the needs of ~97% of all healthy individuals in a particular age and gender group 2. Intakes slightly above or below the RDA are of no concern 3. Intakes below 70% RDA or 3x or more above the RDA for an extended period can lead to deficiency or toxicity, respectively. C. Adequate Intake (AI) 1. Set if there is not sufficient information on human needs to set an RDA 2. Further research is required before scientists can establish a more definitive number 3. Derived from dietary intakes of people who appear to be maintaining nutritional health (no deficiency apparent) D. Estimated Energy Requirement (EER) 1. Not set higher than average need (as for vitamins and minerals) because this would lead to excess calories and weight gain; starting point for estimating calorie needs. 2. Takes into account age, gender, height, weight, and physical activity. 3. Also accounts for additional needs during growth and lactation. E. Tolerable Upper Intake Level (UL) 1. The highest amount of a nutrient that is unlikely to cause adverse health effects in the long run for most people. 2. Usually seen with eating patterns promoting excess intake of a limited variety of foods, many fortified foods, or megadoses of specific vitamins or minerals. F. Daily Value (not part of DRIs) 1. Generic standard used on food labelsโ€”usually reflects the highest RDA (or related nutrient standard) seen in various age and gender categories for the nutrient. 2. Based on a 2000-kcal diet. 3. Allows consumers to compare intake from a specific food to desirable (or maximum) intake levels. G. How should these nutrient standards be used? 1. The type of standard that is set depends on the quality of available evidence. 2. Eating patterns should strive to meet the RDA or AI without exceeding the UL. 3. AI should not be used alone to evaluate individual needs. 4. EER is an estimate and may need to be adjusted. Copyright ยฉ 2019 McGraw-Hill Education. All rights reserved. No reproduction or distribution without the prior written consent of McGraw-Hill Education. 5. Standards for each nutrient are found in appendix G of the text or at the link for Dietary Guidance at the Food and Nutrition Information Centerโ€™s website (https://fnic.nal.usda.gov/dietary-guidance/dietary-reference-intakes) 6. Daily Values, which appear on food labels, serve as rough guidelines for comparison of nutrient content of foods to approximate human needs; set at or close to highest RDA value. 7. Figure 2-11 illustrates how the various nutrient standards relate to each other and the risk for deficiency or toxicity. 2.7 Evaluating Nutrition Information A. Ensure that the nutrition claim adheres to basic principles of nutrition (e.g., Dietary Guidelines for Americans) B. Examine background and scientific credentials of the individual, organization, or publication making the nutritional claim. C. Beware of bad science 1. Possible disadvantages are ignored 2. Claims sound too good to be true; claim a โ€œcureโ€ 3. Evidence of bias against medical community 4. Touted as a โ€œbreakthroughโ€ D. Consider the study 1. Note the size and duration of the study; larger study and longer duration are better. 2. Note the type of study (i.e., epidemiology, caseโ€“control, double-blind). E. Beware of hype F. Expect a nutrition professional to 1. Inquire about medical history, lifestyle, and current eating habits 2. Formulate an individualized eating pattern 3. Schedule follow-up visits to monitor progress 4. Involve social support 5. Consult with other health professionals G. Avoid megadoses of nutrient supplements. H. Examine product labels carefully. I. Seek advice from reputable professional, including a primary care physician or registered dietitian nutritionist (RDN). 2.8 Nutrition and Your Health: Food Labels and Diet Planning A. Overview 1. Labels must include product name, manufacturer name and address, amount of product in package, ingredients in descending order by weight. 2. Monitored by FDA 3. Nutrition Facts panel (Figure 2-12) must include a. Total calories (kcal) b. Total fat c. Saturated fat d. Trans fat e. Cholesterol Copyright ยฉ 2019 McGraw-Hill Education. All rights reserved. No reproduction or distribution without the prior written consent of McGraw-Hill Education. f. Sodium g. Total carbohydrate h. Fiber i. Total sugars j. Added sugars k. Protein l. Vitamin A, vitamin D, calcium, iron, and potassium m. Monounsaturated or polyunsaturated fats, potassium, and others listed if health claims are made about them or if food is fortified with them. 4. Percentage of the Daily Value usually listed for each nutrient per serving 5. Serving sizes must be consistent among similar foods but are not necessarily the same as what is recommended by MyPlateโ€™s Daily Food Plans. 6. Nutrient claims must follow legal definitions (see Table 2-10). B. Changes to nutrition labels approved 1. Figure 2-13 illustrates the new Nutrition Facts Labels with changes noted that were approved May 2016. 2. Increased type size for โ€œCalories,โ€ โ€œServings per container,โ€ and the โ€œServing sizeโ€ declaration. 3. The number of calories and โ€œServing sizeโ€ declaration will be in bold. 4. Daily value information for nutrients will be updated and will include the actual amount for vitamin D, calcium, iron, and potassium. 5. โ€œAdded Sugarsโ€ is an addition to the label. 6. โ€œCalories from fatโ€ will be removed. 7. Serving size information will more accurately reflect how much is consumed in one sitting. 8. Larger packages will have two columns on label to note โ€œper servingโ€ and โ€œper package.โ€ 9. July 2018 is the deadline for implementation for manufacturers with $10 million in food sales per year. C. Menu planning with labels 1. Daily Values generally align with RDAs and AIs for nutrients. 2. Food labels are useful for identifying nutrient-dense foods. D. Exceptions to food labeling 1. Fresh foods (e.g., fruit, vegetables, and fish) are not required to have Nutrition Facts labels. 2. As protein deficiency is so rare in the US, %DV for protein is not required for the products designed for people aged 4 years or older 3. If % DV is included, the product must be analyzed for protein quality 4. Food Allergen Labeling and Consumer Protection Act of 2004 (FALCPA) requires manufacturers to label food products that contain an ingredient that is or contains protein from a major food allergen. E. Health claims on food labels 1. Four categories of claims are used on food labels a. Health claims โ€“ closely regulated by FDA b. Preliminary health claims โ€“ regulated by FDA but evidence may be scant for the claim Copyright ยฉ 2019 McGraw-Hill Education. All rights reserved. No reproduction or distribution without the prior written consent of McGraw-Hill Education. c. Nutrient claims โ€“ closely regulated by FDA (see Table 2-10) d. Structure/function claims (not FDA approved, or necessarily valid) 2. FDA permits some health claims with restrictions a. There must be a significant scientific agreement that a relationship exists between the nutrient and the disease. b. Food must be a โ€œgood sourceโ€ of fiber, protein, vitamin A, vitamin C, calcium, or iron. c. Single serving of the food product cannot contain more than 13 grams of fat, 4 grams of saturated fat, 60 milligrams of cholesterol, or 480 milligrams of sodium 3. Current allowed health claims a. Calcium and vitamin D for reduced risk of osteoporosis b. Low total fat intake and reduced risk of some cancers c. Low saturated fat and cholesterol intake for reduced risk of cardiovascular disease (CVD) d. Fiber from fruits, vegetables, and grains for reduced risk of cancers e. Low sodium and high potassium for reduced risk of hypertension and stroke f. Fruits and vegetables and reduced risk of some cancers g. Folate for reduced risk of neural tube defects h. Sugarless gum for reduced risk of tooth decay i. Fruits, vegetables, and grain products that contain fiber for reduced risk of CVD; oats and psyllium can be singled out in reduction of CVD risk j. Eating pattern rich in whole grains and other plant foods, low in total fat, saturated fat and cholesterol for reduced risk of CVD k. Soy protein and reduced risk of CVD l. Fatty acids from fish for reduced risk of CVD m. Plant stanols and sterols for reduced risk of CVD 4. Table 2-10 describes allowable nutrient claims in detail, such as a. Sugar free: <0.5 grams per serving b. Reduced fat: 25% less fat than the reference product c. Fortified or enriched: vitamins or minerals have been added back to at least 10% of what is normally present d. Good source: serving of food contains 10โ€“19% of the DV for a particular nutrient RATE YOUR PLATE Does Your Diet Compare to MyPlate? Using your food-intake record from Chapter 1, place each food item in the appropriate group of the accompanying MyPlate chart. That is, for each food item, indicate how many servings it contributes to each group based on the amount you ate (see Food Composition Table Supplement for serving sizes). Many of your food choices may contribute to more than one group. For example, spaghetti with meat sauce contributes to three categories: grains, vegetables, and proteins. After entering all the values, add the number of servings consumed in each group. Copyright ยฉ 2019 McGraw-Hill Education. All rights reserved. No reproduction or distribution without the prior written consent of McGraw-Hill Education. Finally, compare your total in each food group with the recommended number of servings shown in Table 2-5 or obtained from the ChooseMyPlate.gov website. Enter a minus sign (โ€“) if your total falls below the recommendation or a plus sign (+) if it equals or exceeds the recommendation. Indicate the number of servings from MyPlate that each food yields: Food or beverage Orange juice Crispix Nonfat milk Sugar Black coffee Diet cola Chicken sandwich with lettuce and mayonnaise Pear Nonfat milk Regular cola Pork chop Baked potato Margarine Lettuce and tomato salad Ranch dressing Peas (green) Whole milk Cherry pie Iced tea Apple Water Group totals Recommended servings (2000-kcal plan) Shortages/overages in numbers of servings Amount Eaten 1 cup 1 cup ยฝ cup 2 tsp 1 cup 12 oz 3 oz chicken, 2 slices white bread, 2 tsp mayonnaise 1 medium 1 cup 12 oz 3 oz 1 medium 2 tbsp 1 cup 2 tbsp ยฝ cup 1 cup 1 piece 12 oz 1 medium 1 cup Grains 0 1 0 0 0 0 0 Vegetables 0 0 0 0 0 0 0 Fruits 1 0 0 0 0 0 0 Dairy 0 0 0.5 0 0 0 0 Protein 0 0 0 0 0 0 3 2 0 0 0 0 0 0 0 0 0 0 0 0 0 0 0 1.5 0 0 0 4.5 6 0 0 0 0 0 1 0 0.75 0 0.5 0 0 0 0 0 2.25 2.5 0 1 0 0 0 0 0 0 0 0 0 0 0 1.5 0 3.5 2 0 0 1 0 0 0 0 0 0 0 1 0 0 0 0 2.5 3 0 0 0 0 3 0 0 0 0 0 0 0 0 0 0 6 5.5 – – + – + Copyright ยฉ 2019 McGraw-Hill Education. All rights reserved. No reproduction or distribution without the prior written consent of McGraw-Hill Education.

Document Preview (11 of 266 Pages)

User generated content is uploaded by users for the purposes of learning and should be used following SchloarOn's honor code & terms of service.
You are viewing preview pages of the document. Purchase to get full access instantly.

Shop by Category See All


Shopping Cart (0)

Your bag is empty

Don't miss out on great deals! Start shopping or Sign in to view products added.

Shop What's New Sign in