Solution Manual for Mathematical Modeling, 4th Edition

Preview Extract
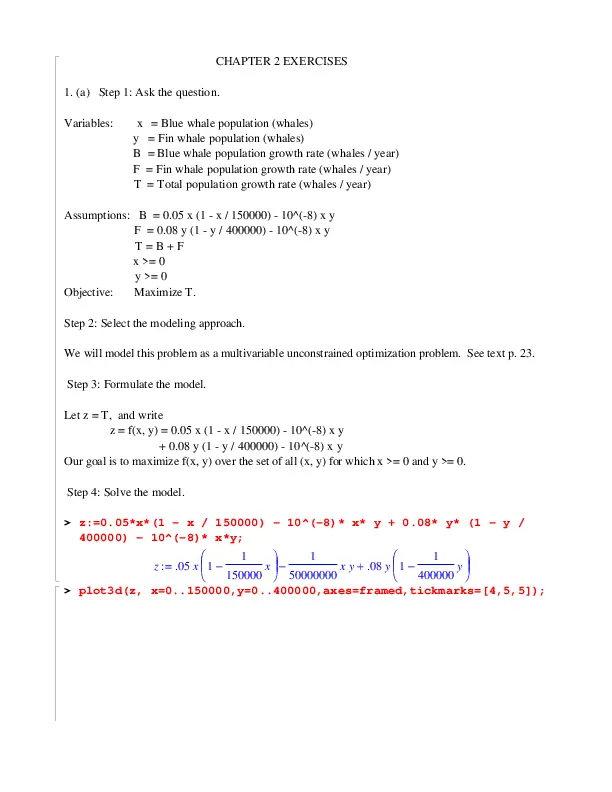
CHAPTER 2 EXERCISES 1. (a) Step 1: Ask the question. Variables: x = Blue whale population (whales) y = Fin whale population (whales) B = Blue whale population growth rate (whales / year) F = Fin whale population growth rate (whales / year) T = Total population growth rate (whales / year) Assumptions: B = 0.05 x (1 – x / 150000) – 10^(-8) x y F = 0.08 y (1 – y / 400000) – 10^(-8) x y T=B+F x >= 0 y >= 0 Objective: Maximize T. Step 2: Select the modeling approach. We will model this problem as a multivariable unconstrained optimization problem. See text p. 23. Step 3: Formulate the model. Let z = T, and write z = f(x, y) = 0.05 x (1 – x / 150000) – 10^(-8) x y + 0.08 y (1 – y / 400000) – 10^(-8) x y Our goal is to maximize f(x, y) over the set of all (x, y) for which x >= 0 and y >= 0. Step 4: Solve the model. > z:=0.05*x*(1 – x / 150000) – 10^(-8)* x* y + 0.08* y* (1 – y / 400000) – 10^(-8)* x*y; ๏ฃซ 1 ๏ฃถ 1 ๏ฃซ 1 ๏ฃถ z := .05 x ๏ฃฌ๏ฃฌ 1 โˆ’ x ๏ฃท๏ฃท โˆ’ x y + .08 y ๏ฃฌ๏ฃฌ 1 โˆ’ y ๏ฃท๏ฃท ๏ฃญ 150000 ๏ฃธ 50000000 ๏ฃญ 400000 ๏ฃธ > plot3d(z, x=0..150000,y=0..400000,axes=framed,tickmarks=[4,5,5]); > dzdx:=diff(z,x); dzdx := .05 โˆ’ .6666666666 10-6 x โˆ’ 1 50000000 y > dzdy:=diff(z,y); dzdy := โˆ’ 1 50000000 > solve({dzdx=0,dzdy=0},{x,y}); x + .08 โˆ’ .4000000000 10-6 y { y = 196544.8172, x = 69103.65549 } > assign(%); > z; 9589.384075 The graph indicates that the maximum occurs at the unique point where the gradient vector is zero. This point is x = 69103, y = 196545, z = 9589. Step 5: Answer the question. A population of 196,545 Fin whales and 69,103 Blue whales will result in 9,589 whale births per year, which is the maximum. (b) Let r1 denote the growth rate for Blue whales, where currently we assume r1 = 0.05. Generalizing the calculations of part (a) we now have > restart: > z:=r1*x*(1 – x / 150000) – 10^(-8)* x* y + 0.08* y* (1 – y / 400000) – 10^(-8)* x*y; ๏ฃซ 1 ๏ฃถ 1 ๏ฃซ 1 ๏ฃถ z := r1 x ๏ฃฌ๏ฃฌ 1 โˆ’ x ๏ฃท๏ฃท โˆ’ x y + .08 y ๏ฃฌ๏ฃฌ 1 โˆ’ y ๏ฃท๏ฃท ๏ฃญ 150000 ๏ฃธ 50000000 ๏ฃญ 400000 ๏ฃธ > dzdx:=diff(z,x); > dzdy:=diff(z,y); ๏ฃซ 1 ๏ฃถ 1 1 dzdx := r1 ๏ฃฌ๏ฃฌ 1 โˆ’ x ๏ฃท๏ฃท โˆ’ r1 x โˆ’ y ๏ฃญ 150000 ๏ฃธ 150000 50000000 1 dzdy := โˆ’ x + .08 โˆ’ .4000000000 10-6 y 50000000 > s:=solve({dzdx=0,dzdy=0},{x,y}); > assign(s); s := { y = .7850000000 1010 r1 , x = .12000000 108 40000. r1 โˆ’ 3. 250. r1 โˆ’ 1. 40000. r1 โˆ’ 3. } > dxdr1:=diff(x,r1); > dydr1:=diff(y,r1); > assign(r1=0.05); 1 10 dxdr1 := .3000000000 10 40000. r1 โˆ’ 3. dydr1 := โˆ’.3140000000 10 15 โˆ’ .4800000000 1012 ( 250. r1 โˆ’ 1. ) r1 ( 40000. r1 โˆ’ 3. )2 ( 40000. r1 โˆ’ 3. )2 + .7850000000 1010 40000. r1 โˆ’ 3. > sxr1:=dxdr1*(r1/x); > syr1:=dydr1*(r1/y); sxr1 := .08545426807 syr1 := -.001502253044 Then S(x, r_1) = +0.085 and S(y, r_1) = -0.0015 and so both optimal population levels are quite insensitive to the intrinsic growth rate for Blue whales. Now let r2 denote the intrinsic growth rate for Fin whales, where currently we assume r1 = 0.08. Calculate that > restart: > z:=0.05*x*(1 – x / 150000) – 10^(-8)* x* y + r2* y* (1 – y / 400000) – 10^(-8)* x*y; ๏ฃซ 1 ๏ฃถ 1 ๏ฃซ 1 ๏ฃถ z := .05 x ๏ฃฌ๏ฃฌ 1 โˆ’ x ๏ฃท๏ฃท โˆ’ x y + r2 y ๏ฃฌ๏ฃฌ 1 โˆ’ y ๏ฃท๏ฃท ๏ฃญ 150000 ๏ฃธ 50000000 ๏ฃญ 400000 ๏ฃธ > dzdx:=diff(z,x); > dzdy:=diff(z,y); dzdx := .05 โˆ’ .6666666666 10-6 x โˆ’ 1 50000000 y ๏ฃซ 1 ๏ฃถ 1 x + r2 ๏ฃฌ๏ฃฌ 1 โˆ’ y ๏ฃท๏ฃท โˆ’ r2 y 50000000 ๏ฃญ 400000 ๏ฃธ 400000 > s:=solve({dzdx=0,dzdy=0},{x,y}); > assign(s); 1 dzdy := โˆ’ s := { y = 200000. โˆ’.5000000 107 + .3333333333 1010 r2 .3333333333 1010 r2 โˆ’ 400000. , r2 x = .2300000000 1015 .3333333333 1010 r2 โˆ’ 400000. > dxdr2:=diff(x,r2): > dydr2:=diff(y,r2): > assign(r2=0.08); > sxr2:=dxdr2*(r2/x); > syr2:=dydr2*(r2/y); } sxr2 := -.001502254074 syr2 := .01760602701 Then S(x, r_2) = -0.0015 and S(y, r_2) = +0.0176 and so both optimal population levels are also quite insensitive to the intrinsic growth rate for Fin whales. Understandably the optimal populations are more sensitive to their own growth rate than to that of the other population. (c) Now let K1 be the carrying capacity for Blue whales, where currently K1 = 150000. > unassign(‘x’,’y’); > z:=0.05*x*(1 – x / K1) – 10^(-8)* x* y + 0.08* y* (1 – y / 400000) – 10^(-8)* x*y; ๏ฃซ x ๏ฃถ 1 ๏ฃซ 1 ๏ฃถ ๏ฃท๏ฃท โˆ’ z := .05 x ๏ฃฌ๏ฃฌ 1 โˆ’ x y + .08 y ๏ฃฌ๏ฃฌ 1 โˆ’ y ๏ฃท๏ฃท ๏ฃญ K1 ๏ฃธ 50000000 ๏ฃญ 400000 ๏ฃธ > dzdx:=diff(z,x); > dzdy:=diff(z,y); dzdx := .05 โˆ’ dzdy := โˆ’ .10 x K1 โˆ’ 1 50000000 y 1 x + .08 โˆ’ .4000000000 10-6 y 50000000 > s:=solve({dzdx=0,dzdy=0},{x,y}); > assign(s); s := { y = .2500000 10 7 K1 โˆ’ .8000000 107 โˆ’.100000000 109 + K1 , x = โˆ’.46000000 108 K1 โˆ’.100000000 109 + K1 } > dxdK1:=diff(x,K1): > dydK1:=diff(y,K1): > assign(K1=150000); > sxK1:=dxdK1*(K1/x); > syK1:=dydK1*(K1/y); sxK1 := 1.001502253 syK1 := -.01760602687 Then S(x, K_1) = +1.0015 and S(y, K_1) = -0.0176 so that if the carrying capacity for Blue whales increases by 10% then the optimal population for Blue whales increases by about 10% and the optimal population for Fin whales stays about the same. Now compute that > restart: > z:=0.05*x*(1 – x / 150000) – 10^(-8)* x* y + 0.08* y* (1 – y / K2) – 10^(-8)* x*y; ๏ฃซ 1 ๏ฃถ 1 ๏ฃซ y ๏ฃถ ๏ฃท๏ฃท z := .05 x ๏ฃฌ๏ฃฌ 1 โˆ’ x ๏ฃท๏ฃท โˆ’ x y + .08 y ๏ฃฌ๏ฃฌ 1 โˆ’ ๏ฃญ 150000 ๏ฃธ 50000000 ๏ฃญ K2 ๏ฃธ > dzdx:=diff(z,x); > dzdy:=diff(z,y); dzdx := .05 โˆ’ .6666666666 10-6 x โˆ’ dzdy := โˆ’ 1 50000000 > s:=solve({dzdx=0,dzdy=0},{x,y}); > assign(s); s := { y = โˆ’.3270833333 1010 x = .100000000 10 9 x + .08 โˆ’ K2 25. K2 โˆ’ .6666666666 1010 K2 โˆ’ .5000000 107 25. K2 โˆ’ .6666666666 1010 > dxdK2:=diff(x,K2): > dydK2:=diff(y,K2): > assign(K2=400000); > sxK2:=dxdK2*(K2/x); > syK2:=dydK2*(K2/y); 1 50000000 y .16 y K2 , } sxK2 := -.08545426835 syK2 := 1.001502253 Then S(x, K_2) = -0.085 and S(y, K_2) = +1.0015 so that if the carrying capacity for Fin whales increases by 10% then the optimal population for Fin whales increases by about 10% and the optimal population for Blue whales stays about the same. (d) Now we let a = alpha be the competition parameter, and we calculate > unassign(‘x’,’y’); > z:=0.05*x*(1 – x / 150000) – a* x* y + 0.08* y* (1 – y / K2) – a* x*y; ๏ฃซ 1 ๏ฃถ ๏ฃซ 1 ๏ฃถ z := .05 x ๏ฃฌ๏ฃฌ 1 โˆ’ x ๏ฃท๏ฃท โˆ’ 2 a x y + .08 y ๏ฃฌ๏ฃฌ 1 โˆ’ y ๏ฃท๏ฃท ๏ฃญ 150000 ๏ฃธ ๏ฃญ 400000 ๏ฃธ > dzdx:=diff(z,x); > dzdy:=diff(z,y); dzdx := .05 โˆ’ .6666666666 10-6 x โˆ’ 2 a y dzdy := โˆ’2 a x + .08 โˆ’ .4000000000 10-6 y > s:=solve({dzdx=0,dzdy=0},{x,y}); > assign(s); s := { x = .2500000000 10 15 y = 200000. โˆ’1. + .8000000 107 a โˆ’.3333333333 1010 + .5000000000 1023 a2 .6250000000 1016 a โˆ’ .3333333333 1010 โˆ’.3333333333 1010 + .5000000000 1023 a2 > plot({x,y},a=0..2*10^(-7)); > solve(x=0); .1250000000 10-6 } , so that when alpha_1 = alpha_2 =a > .000000125 it is optimal to extinct the Blue whales. 2. (a) Step 1: Ask the question. Variables: x = Blue whale population (whales) y = Fin whale population (whales) B = Blue whale population growth rate (whales / year) F = Fin whale population growth rate (whales / year) P = Total population (whales) Assumptions: B = 0.05 x (1 – x / 150000) – 10^(-8) x y F = 0.08 y (1 – y / 400000) – 10^(-8) x y P =x+y x >= 0, y >= 0 B >= 0, F >= 0 Objective: Maximize P. Step 2: Select the modeling approach. We will model this problem as a multivariable constrained optimization problem which will be solved using the method of Lagrange multipliers. See text p. 33. Step 3: Formulate the model. Let z = P, and write z = f(x, y) = x + y we wish to maximize z over the set of x >= 0 and y >= 0 which satisfy the additional constraints 0 <= g1(x, y) = 0.05 x (1 – x / 150000) – 10^(-8) x y 0 unassign(‘x’,’y’); > g1:=0.05*x*(1 – x / 150000) – 10^(-8)* x* y; > g2:=0.08*y*(1 – y / 400000) – 10^(-8)* x* y; ๏ฃซ 1 ๏ฃถ 1 g1 := .05 x ๏ฃฌ๏ฃฌ 1 โˆ’ x ๏ฃท๏ฃท โˆ’ xy ๏ฃญ 150000 ๏ฃธ 100000000 ๏ฃซ 1 ๏ฃถ 1 g2 := .08 y ๏ฃฌ๏ฃฌ 1 โˆ’ y ๏ฃท๏ฃท โˆ’ xy ๏ฃญ 400000 ๏ฃธ 100000000 > dg1dx:=diff(g1,x); > dg1dy:=diff(g1,y); > dg2dx:=diff(g2,x); > dg2dy:=diff(g2,y); dg1dx := .05 โˆ’ .6666666666 10-6 x โˆ’ dg1dy := โˆ’ dg2dx := โˆ’ 1 100000000 1 100000000 1 100000000 y x y dg2dy := .08 โˆ’ .4000000000 10-6 y โˆ’ 1 100000000 x > solve({dg1dx=1,dg1dy=1},{x,y}); > solve({dg2dx=1,dg2dy=1},{x,y}); { x = -.100000000 109, y = .6571666666 1010 } { y = -.100000000 109, x = .3908000000 1010 } Here also there are no local max or min since the Lagrange multiplier equations have no solution in the feasible region. Then the max (and the min) must occur at one of the corners. At (0,0) we have the minimum z = 0. Now we will check the other corner points. > solve({y=0,g1/x=0}); { y = 0., x = 150000. } > solve({x=0,g2/y=0}); { x = 0., y = 400000. } > solve({g1/x=0,g2/y=0}); { y = 393089.6345, x = 138207.3110 } > assign(%);x+y; 531296.9455 Then the maximum occurs at the only corner point at which both x and y are positive. At this corner point (138207, 393090) we have the maximum value z = 531297. Step 5: Answer the question. A population of 393,090 Fin whales and 138,207 Blue whales will result in a total of 531,297 whales, which is the maximum. At these population levels, both growth rates are zero, and so both populations will remain the same as time goes on. This is the largest population that the ecosystem can support. It is slightly less than the theoretical maximum of 550,000 obtained by summing the carrying capacity for both species, because of the effects of competition. (b) Let r1 denote the growth rate for Blue whales, where currently we assume r1 = 0.05. Generalizing the calculations of part (a) we now have > unassign(‘x’,’y’,’r1′); > g1:=r1*x*(1 – x / 150000) – 10^(-8)* x* y; > g2:=0.08*y*(1 – y / 400000) – 10^(-8)* x* y; ๏ฃซ 1 ๏ฃถ 1 g1 := r1 x ๏ฃฌ๏ฃฌ 1 โˆ’ x ๏ฃท๏ฃท โˆ’ xy ๏ฃญ 150000 ๏ฃธ 100000000 ๏ฃซ 1 ๏ฃถ 1 g2 := .08 y ๏ฃฌ๏ฃฌ 1 โˆ’ y ๏ฃท๏ฃท โˆ’ xy ๏ฃญ 400000 ๏ฃธ 100000000 > solve({g1/x=0,g2/y=0},{x,y}); { x = .24000000 108 250. r1 โˆ’ 1. 40000. r1 โˆ’ 3. , y = .1570000000 1011 r1 40000. r1 โˆ’ 3. } > assign(%); > dxdr1:=diff(x,r1); > dydr1:=diff(y,r1); 1 10 dxdr1 := .6000000000 10 40000. r1 โˆ’ 3. dydr1 := โˆ’.6280000000 10 15 โˆ’ .9600000000 1012 ( 250. r1 โˆ’ 1. ) r1 ( 40000. r1 โˆ’ 3. )2 ( 40000. r1 โˆ’ 3. )2 + .1570000000 1011 40000. r1 โˆ’ 3. > assign(r1=0.05): > sxr1:=dxdr1*(r1/x); > syr1:=dydr1*(r1/y); sxr1 := .08545426841 syr1 := -.001502253044 Then S(x, r_1) = +0.085 and S(y, R_1) = -0.0015 and so both optimal population levels are quite insensitive to the intrinsic growth rate for Blue whales. Now let r2 denote the intrinsic growth rate for Fin whales, where currently we assume r1 = 0.08. Calculate that > unassign(‘x’,’y’,’r2′); > g1:=0.05*x*(1 – x / 150000) – 10^(-8)* x* y; > g2:=r2*y*(1 – y / 400000) – 10^(-8)* x* y; ๏ฃซ 1 ๏ฃถ 1 g1 := .05 x ๏ฃฌ๏ฃฌ 1 โˆ’ x ๏ฃท๏ฃท โˆ’ xy ๏ฃญ 150000 ๏ฃธ 100000000 ๏ฃซ 1 ๏ฃถ 1 g2 := r2 y ๏ฃฌ๏ฃฌ 1 โˆ’ y ๏ฃท๏ฃท โˆ’ xy ๏ฃญ 400000 ๏ฃธ 100000000 > solve({g1/x=0,g2/y=0},{x,y}); > assign(%); { x = .3450000000 1010 r2 โˆ’3. + 25000. r2 , y = .5000000 107 โˆ’3. + 2000. r2 โˆ’3. + 25000. r2 } > dxdr2:=diff(x,r2): > dydr2:=diff(y,r2): > assign(r2=0.08); > sxr2:=dxdr2*(r2/x); > syr2:=dydr2*(r2/y); sxr2 := -.001502253379 syr2 := .01760602680 Then S(x, r_2) = -0.0015 and S(y, r_2) = +0.0176 and so both optimal population levels are also quite insensitive to the intrinsic growth rate for Fin whales. Understandably the optimal populations are more sensitive to their own growth rate than to that of the other population. (c) Now let K1 be the carrying capacity for Blue whales, where currently K1 = 150000. > unassign(‘x’,’y’,’K1′); > g1:=0.05*x*(1 – x / K1) – 10^(-8)* x* y; > g2:=0.08*y*(1 – y / 400000) – 10^(-8)* x* y; ๏ฃซ x ๏ฃถ 1 ๏ฃท๏ฃท โˆ’ g1 := .05 x ๏ฃฌ๏ฃฌ 1 โˆ’ xy ๏ฃญ K1 ๏ฃธ 100000000 ๏ฃซ 1 ๏ฃถ 1 g2 := .08 y ๏ฃฌ๏ฃฌ 1 โˆ’ y ๏ฃท๏ฃท โˆ’ xy ๏ฃญ 400000 ๏ฃธ 100000000 > solve({g1/x=0,g2/y=0},{x,y}); > assign(%); { y = .5000000 10 7 K1 โˆ’ .8000000 107 โˆ’.100000000 109 + K1 > dxdK1:=diff(x,K1): > dydK1:=diff(y,K1): > assign(K1=150000); > sxK1:=dxdK1*(K1/x); > syK1:=dydK1*(K1/y); , x = โˆ’.92000000 108 K1 โˆ’.100000000 109 + K1 } sxK1 := 1.001502253 syK1 := -.01760602687 Then S(x, K_1) = +1.00015 and S(y, K_1) = -0.0176 so that if the carrying capacity for Blue whales increases by 10% then the optimal population for Blue whales increases by about 10% and the optimal population for Fin whales stays about the same. Now compute that > unassign(‘x’,’y’,’K2′); > g1:=0.05*x*(1 – x / 150000) – 10^(-8)* x* y; > g2:=0.08*y*(1 – y / K2) – 10^(-8)* x* y; ๏ฃซ 1 ๏ฃถ 1 g1 := .05 x ๏ฃฌ๏ฃฌ 1 โˆ’ x ๏ฃท๏ฃท โˆ’ xy ๏ฃญ 150000 ๏ฃธ 100000000 ๏ฃซ y ๏ฃถ 1 ๏ฃท๏ฃท โˆ’ g2 := .08 y ๏ฃฌ๏ฃฌ 1 โˆ’ xy ๏ฃญ K2 ๏ฃธ 100000000 > solve({g1/x=0,g2/y=0},{x,y}); > assign(%); { x = .24000000 10 8 K2 โˆ’ .5000000 107 , y = โˆ’.785000000 109 9 3. K2 โˆ’ .800000000 10 > dxdK2:=diff(x,K2): > dydK2:=diff(y,K2): > assign(K2=400000); > sxK2:=dxdK2*(K2/x); > syK2:=dydK2*(K2/y); K2 3. K2 โˆ’ .800000000 109 } sxK2 := -.08545426833 syK2 := 1.001502254 Then S(x, K_2) = -0.085 and S(y, K_2) = +1.0015 so that if the carrying capacity for Fin whales increases by 10% then the optimal population for Fin whales increases by about 10% and the optimal population for Blue whales stays about the same. (d) Now we let a = alpha be the competition parameter, and we calculate > unassign(‘x’,’y’,’a’); > g1:=0.05*x*(1 – x / 150000) – a* x* y; > g2:=0.08*y*(1 – y / 400000) – a* x* y; ๏ฃซ 1 ๏ฃถ g1 := .05 x ๏ฃฌ๏ฃฌ 1 โˆ’ x ๏ฃท๏ฃท โˆ’ a x y ๏ฃญ 150000 ๏ฃธ ๏ฃซ 1 ๏ฃถ g2 := .08 y ๏ฃฌ๏ฃฌ 1 โˆ’ y ๏ฃท๏ฃท โˆ’ a x y ๏ฃญ 400000 ๏ฃธ > solve({g1/x=0,g2/y=0},{x,y}); > assign(%); { x = 150000. โˆ’1. + .8000000 107 a โˆ’1. + .1500000000 1014 a2 > plot({x,y},a=0..2*10^(-7)); > solve(x=0); , y = 400000. โˆ’1. + .1875000 107 a โˆ’1. + .1500000000 1014 a2 } .1250000000 10-6 so that when alpha_1 = alpha_2 =a > .000000125 it is optimal to extinct the Blue whales. If you also solved problem 1, then you saw a marked similarity in answers. This is because the population levels which maximize growth rate are (apparently) always exactly half of the levels which maximize total population. 3. (a) Step 1: Ask the question. Variables: x = Blue whale population (whales) y = Fin whale population (whales) B = Blue whale harvest rate (whales / year) F = Fin whale harvest rate (whales / year) R = Total revenue ($1000 / year) Assumptions: B = 0.05 x (1 – x / 150000) – 10^(-8) x y F = 0.08 y (1 – y / 400000) – 10^(-8) x y R = 12 B + 6 F x >= 0 y >= 0 Objective: Maximize R. Step 2: Select the modeling approach. We will model this problem as a multivariable unconstrained optimization problem. See text p. 23. Step 3: Formulate the model. Let z = R, and write z = f(x, y) = 12 (0.05 x (1 – x / 150000) – 10^(-8) x y) + 6 (0.08 y (1 – y / 400000) – 10^(-8) x y) Our goal is to maximize f(x, y) over the set of all (x, y) for which x >= 0 and y >= 0. Step 4: Solve the model. > restart: z:=12*(0.05*x*(1 – x / 150000)-10^(-8)*x*y) +6*(0.08*y*(1 – y / 400000)-10^(-8)* x*y); ๏ฃซ 1 ๏ฃถ 9 ๏ฃซ 1 ๏ฃถ z := .60 x ๏ฃฌ๏ฃฌ 1 โˆ’ x ๏ฃท๏ฃท โˆ’ x y + .48 y ๏ฃฌ๏ฃฌ 1 โˆ’ y ๏ฃท๏ฃท ๏ฃญ 150000 ๏ฃธ 50000000 ๏ฃญ 400000 ๏ฃธ > plot3d(z, x=0..150000,y=0..400000,axes=framed,tickmarks=[4,5,5]); > dzdx:=diff(z,x); > dzdy:=diff(z,y); dzdx := .60 โˆ’ .8000000000 10-5 x โˆ’ 9 50000000 y dzdy := โˆ’ 9 50000000 > solve({dzdx=0,dzdy=0},{x,y}); > assign(%); x + .48 โˆ’ .2400000000 10-5 y { y = 194703.5623, x = 70619.16985 } > z; 67914.60589 The graph indicates that the maximum occurs at the unique point where the gradient vector is zero. This point is x = 70619, y = 194703, z = 67915. Step 5: Answer the question. A population of 194703 Fin whales and 70619 Blue whales will result in the maximum revenue. At these population levels, the annual harvest is worth around $68 million. (b,c) Let r1 denote the growth rate for Blue whales, where currently we assume r1 = 0.05. Generalizing the calculations of part (a) we now have > unassign(‘x’,’y’,’r1′); > z:=12*(r1*x*(1 – x / 150000)-10^(-8)*x*y)+6*(0.08*y*(1 – y / 400000)-10^(-8)* x*y); ๏ฃซ 1 ๏ฃถ 9 ๏ฃซ 1 ๏ฃถ z := 12 r1 x ๏ฃฌ๏ฃฌ 1 โˆ’ x ๏ฃท๏ฃท โˆ’ x y + .48 y ๏ฃฌ๏ฃฌ 1 โˆ’ y ๏ฃท๏ฃท ๏ฃญ 150000 ๏ฃธ 50000000 ๏ฃญ 400000 ๏ฃธ > dzdx:=diff(z,x); > dzdy:=diff(z,y); ๏ฃซ 1 ๏ฃถ 1 9 dzdx := 12 r1 ๏ฃฌ๏ฃฌ 1 โˆ’ x ๏ฃท๏ฃท โˆ’ r1 x โˆ’ y ๏ฃญ 150000 ๏ฃธ 12500 50000000 dzdy := โˆ’ 9 x + .48 โˆ’ .2400000000 10-5 y 50000000 > s:=solve({dzdx=0,dzdy=0},{x,y}); s := { x = .24000000 108 > assign(s); > dxdr1:=diff(x,r1): > dydr1:=diff(y,r1): > dzdr1:=diff(z,r1): > assign(r1=0.05); > sxr1:=dxdr1*(r1/x); > syr1:=dydr1*(r1/y); โˆ’3. + 1000. r1 โˆ’27. + 320000. r1 , y = .6220000000 1011 r1 โˆ’27. + 320000. r1 } > szr1:=dzdr1*(r1/z); sxr1 := .06213943480 syr1 := -.001690352484 szr1 := .3301680548 Then S(x, r_1) = +0.062 and S(y, R_1) = -0.0017 and so both optimal population levels are quite insensitive to the intrinsic growth rate for Blue whales. Also S(z, r_1) = +0.33 so that if the intrinsic growth rate for Blue whales is 10% bigger than expected, then the annual revenue from whaling at the optimal population levels will be 3.3% larger than expected. Now let r2 denote the intrinsic growth rate for Fin whales, where currently we assume r1 = 0.08. Calculate that > unassign(‘x’,’y’,’r2′); > z:=12*(0.05*x*(1 – x / 150000)-10^(-8)*x*y)+6*(r2*y*(1 – y / 400000)-10^(-8)* x*y); ๏ฃซ 1 ๏ฃถ 9 ๏ฃซ 1 ๏ฃถ z := .60 x ๏ฃฌ๏ฃฌ 1 โˆ’ x ๏ฃท๏ฃท โˆ’ x y + 6 r2 y ๏ฃฌ๏ฃฌ 1 โˆ’ y ๏ฃท๏ฃท ๏ฃญ 150000 ๏ฃธ 50000000 ๏ฃญ 400000 ๏ฃธ > dzdx:=diff(z,x); > dzdy:=diff(z,y); dzdx := .60 โˆ’ .8000000000 10-5 x โˆ’ 9 50000000 y ๏ฃซ 1 ๏ฃถ 3 x + 6 r2 ๏ฃฌ๏ฃฌ 1 โˆ’ y ๏ฃท๏ฃท โˆ’ r2 y 50000000 ๏ฃญ 400000 ๏ฃธ 200000 > s:=solve({dzdx=0,dzdy=0},{x,y}); > assign(s); dzdy := โˆ’ s := { y = .10000000 108 9 โˆ’9. + 4000. r2 โˆ’27. + 200000. r2 , x = .1410000000 1011 r2 โˆ’27. + 200000. r2 } > dxdr2:=diff(x,r2): > dydr2:=diff(y,r2): > dzdr2:=diff(z,r2): > assign(r2=0.08); > sxr2:=dxdr2*(r2/x); > syr2:=dydr2*(r2/y); > szr2:=dzdr2*(r2/z); sxr2 := -.001690352468 syr2 := .02724855456 szr2 := .7062742491 Then S(x, r_2) = -0.0017 and S(y, r_2) = +0.0272 and so both optimal population levels are also quite insensitive to the intrinsic growth rate for Fin whales. Understandably the optimal populations are more sensitive to their own growth rate than to that of the other population. Also S(z, r_2) = +0.71 so that if the intrinsic growth rate of the Fin whale population is 10% greater than expected, then the total annual revenue from whaling will be 7.1% larger than expected. (d) Now we let a = alpha be the competition parameter, and we calculate > unassign(‘x’,’y’,’a’); > z:=12*(0.05*x*(1 – x / 150000)-a*x*y)+6*(0.08*y*(1 – y / 400000)-a* x*y); ๏ฃซ 1 ๏ฃถ ๏ฃซ 1 ๏ฃถ z := .60 x ๏ฃฌ๏ฃฌ 1 โˆ’ x ๏ฃท๏ฃท โˆ’ 18 a x y + .48 y ๏ฃฌ๏ฃฌ 1 โˆ’ y ๏ฃท๏ฃท ๏ฃญ 150000 ๏ฃธ ๏ฃญ 400000 ๏ฃธ > dzdx:=diff(z,x); dzdx := .60 โˆ’ .8000000000 10-5 x โˆ’ 18 a y > dzdy:=diff(z,y); dzdy := โˆ’18 a x + .48 โˆ’ .2400000000 10-5 y > s:=solve({dzdx=0,dzdy=0},{x,y}); s := { x = 75000. โˆ’1. + .6000000 107 a .1687500000 1014 a2 โˆ’ 1. , y = 200000. > assign(s); > plot({x,y},a=0..2*10^(-7)); > solve(x=0); .1666666667 10-6 .2812500 107 a โˆ’ 1. .1687500000 1014 a2 โˆ’ 1. } so that when alpha_1 = alpha_2 =a > .000000167 it is optimal to extinct the Blue whales. 4. (a) Step 1: Ask the question. Variables: x = Blue whale population (whales) y = Fin whale population (whales) B = Blue whale harvest rate (whales / year) F = Fin whale harvest rate (whales / year) R = Total revenue ($1000 / year) Assumptions: B = 0.05 x (1 – x / 150000) – 10^(-8) x y F = 0.08 y (1 – y / 400000) – 10^(-8) x y R = 12 B + 6 F x >= 75,000 y >= 200,000 Objective: Maximize R. Step 2: Select the modeling approach. We will model this problem as a multivariable constrained optimization problem, and we will solve the problem using the method of Lagrange multipliers. See text p. 33. Step 3: Formulate the model. Let z = R, and write z = f(x, y) = 12 (0.05 x (1 – x / 150000) – 10^(-8) x y) + 6 (0.08 y (1 – y / 400000) – 10^(-8) x y) Our goal is to maximize f(x, y) over the set of all (x, y) for which x >= 75000 and y >= 200000. Step 4: Solve the model. In problem 3 we calculated that the gradient vector is zero when x = 70619, y = 194703. This point is outside the feasible region, so there is no local max or min in the interior of this region. On the line g(x,y) = x = 75000 we use Lagrange multipliers. The gradient of g is (1,0) > restart: z:=12*(0.05*x*(1 – x / 150000)-10^(-8)*x*y)+6*(0.08*y*(1 – y / 400000)-10^(-8)* x*y); ๏ฃซ 1 ๏ฃถ 9 ๏ฃซ 1 ๏ฃถ z := .60 x ๏ฃฌ๏ฃฌ 1 โˆ’ x ๏ฃท๏ฃท โˆ’ x y + .48 y ๏ฃฌ๏ฃฌ 1 โˆ’ y ๏ฃท๏ฃท ๏ฃญ 150000 ๏ฃธ 50000000 ๏ฃญ 400000 ๏ฃธ > dzdx:=diff(z,x); > dzdy:=diff(z,y); dzdx := .60 โˆ’ .8000000000 10-5 x โˆ’ dzdy := โˆ’ 9 9 50000000 y x + .48 โˆ’ .2400000000 10-5 y 50000000 > solve({dzdx=lambda,dzdy=0,x=75000},{x,y,lambda}); { y = 194375., x = 75000., ฮป = -.03498750000 } The maximum occurs at y = 194,375 which is not feasible, so the maximum over this segment of the boundary occurs at the endpoint y = 200,000. Next consider the constraint line g(x,y) = y = 200000. Now the gradient of g is (0,1) > z:=12*(0.05*x*(1 – x / 150000)-10^(-8)*x*y)+6*(0.08*y*(1 – y / 400000)-10^(-8)* x*y); ๏ฃซ 1 ๏ฃถ 9 ๏ฃซ 1 ๏ฃถ z := .60 x ๏ฃฌ๏ฃฌ 1 โˆ’ x ๏ฃท๏ฃท โˆ’ x y + .48 y ๏ฃฌ๏ฃฌ 1 โˆ’ y ๏ฃท๏ฃท ๏ฃญ 150000 ๏ฃธ 50000000 ๏ฃญ 400000 ๏ฃธ > dzdx:=diff(z,x): > dzdy:=diff(z,y): > solve({dzdx=0,dzdy=lambda,y=200000},{x,y,lambda}); { ฮป = -.01269000000, x = 70500., y = 200000. } > assign(‘x=75000′,’y=200000’); > z; 67800.00 Once again the maximum occurs at an infeasible point, so the maximum along the boundary segment is at the vertex of the feasible region x = 75,000 and y = 200,000. At this point z = 67,800. Step 5. The optimal profit will result if both species are kept at 1/2 of the environmental carrying capacity. This will result in an estimated sustained revenue of 67.8 million dollars per year. (b) Assume x >= c where currently c = 150,000. As long as c > 70619 the optimum point will be at x = c and y = 200,000 and so dx/dc = 1 and dy/dc = 0. Then S(y,c) = 0 and S(x,c) = 1. Similarly if we assume y >= b where currently b = 200,000 then as long as b > 194703 the optimum point will be at the vertex x = 150,000 and y = b so that S(x,b) = 0 and S(y,b) = 1. Then it is easy to calculate that for z = sustained profit (revenue) in $1000’s per year we have the sensitivities S(z,c) = 12 (75000/67800) = +13.27 and S(z,b) = 6 (200000/67800) = +17.70. (c) the quotas are 1725 Blue whales and 7850 fin whales per year, as shown below. So if we maximize revenue R subject to the harvest constraints B >= 1725 and F >= 7850 we would get the same maximum as before. > B:=0.05*x*(1 – x / 150000)-10^(-8)*x*y; > F:=0.08*y*(1 – y / 400000)-10^(-8)* x*y; B := 1725.00 F := 7850.00 (d) Since the maximum possible growth rates (and hence the maximum possible sustained harvest rates) for the Blue whale and the Fin whale are 1728 and 7851 respectively, the yearly quotas cannot be raised by any significant amount. If the number of whale kills exceeds the current quotas, this will resul in the eventual decline and extinction of one or both species. > unassign(‘x’,’y’); > assign(‘y=200000’); > B:=0.05*x*(1 – x / 150000)-10^(-8)*x*y; ๏ฃซ 1 ๏ฃถ 1 B := .05 x ๏ฃฌ๏ฃฌ 1 โˆ’ x ๏ฃท๏ฃท โˆ’ x ๏ฃญ 150000 ๏ฃธ 500 > plot(B,x=0..150000); > dBdx:=diff(B,x); dBdx := .04800000000 โˆ’ .6666666666 10-6 x > solve({dBdx=0},{x}); { x = 72000.00001 } > assign(%); > B; 1728.000000 > unassign(‘x’,’y’); > assign(‘x=75000’); > F:=0.08*y*(1 – y / 400000)-10^(-8)* x*y; ๏ฃซ 1 ๏ฃถ 3 F := .08 y ๏ฃฌ๏ฃฌ 1 โˆ’ y ๏ฃท๏ฃท โˆ’ y ๏ฃญ 400000 ๏ฃธ 4000 > plot(F,y=0..400000); > dFdy:=diff(F,y); dFdy := .07925000000 โˆ’ .4000000000 10-6 y > solve({dFdy=0},{y}); > assign(%); { y = 198125. } > F; 7850.703125 > 5. (a) Step 1: Ask the question. Variables: s = sales of 19 inch sets (sets / year) t = sales of 21 inch sets (sets / year) p = price for 19 inch sets ($ / set) q = price for 21 inch sets ($ / set) T = tarriff ($ / set) C = manufacturing cost ($ / year) R = revenue ($ / year) P = profit ($ / year) Assumptions: p = 339 – .01 s – .003 t q = 399 – .004 s – .01 t T = 25 ( s + t) R =ps+qt C = 400,000 + 195 s + 225 t + T P =R-C s >= 0 t >= 0 Objective: Maximize P. Step 2: Select the modeling approach. We will model this problem as a multivariable unconstrained optimization problem. See text p. 23. Step 3: Formulate the model. Let x = s, y = t, and z = P, and write z = f(x, y) = (339 – .01 x – .003 y) x + (399 – .004 x – .01 y) y – (400000 + 195 x + 225 y + 25 (x + y)) Our goal is to maximize f(x, y) over the set of all (x, y) for which x >= 0 and y >= 0. Step 4: Solve the model. > unassign(‘x’,’y’); > z := (339- .01*x – .003*y)*x +(399 – .004*x – .01*y)*y-(400000 + 195*x + 225*y + 25*(x + y)); z := ( 339 โˆ’ .01 x โˆ’ .003 y ) x + ( 399 โˆ’ .004 x โˆ’ .01 y ) y โˆ’ 400000 โˆ’ 220 x โˆ’ 250 y > plot3d(z, x=2000..5000,y=0..8000,axes=framed); > dzdx:=diff(z,x); dzdx := โˆ’.02 x + 119. โˆ’ .007 y > dzdy:=diff(z,y); dzdy := โˆ’.007 x โˆ’ .02 y + 149. > solve({dzdx=0,dzdy=0},{x,y}); { x = 3809.116809, y = 6116.809117 } > assign(%); > z; 282344.729 The graph indicates that the maximum occurs at the unique point where the gradient is zero. We solve to find x = 3809, y = 6117, and z = 282,345 at this point. Step 5. The optimal strategy is to produce 3809 of the 19″ LCD TV sets and 6117 of the 21″ LCD TV sets per year. This will result in about $282,000 profit per year. In the no-tarriff case we made $554,000 per year, so the tarriff has cost the company $272,000 in profits, almost half. Of this amount $248,000 is paid to the government as a tarriff and the remaining $24,000 is due to lost sales. (b) If we move to the US, net operating costs will increase by $350,000 per year. The optimal production policy in this case is the same as the no-tarriff case, i.e. we should make 4735 of the 19 inch and 7043 of the 21 inch sets. We expect profits of 553,641 – 350,000 = 203,641 dollars per year, and so it would NOT be better to move to the US. (c) We will use sensitivity analysis to extimate the minimum increase in tarriffs that will make it optimal for the company to relocate to the US. Let r denote the tarriff amount, where we currently assume r = 25 ($ / set). > unassign(‘x’,’y’); > z := (339- .01*x – .003*y)*x +(399 – .004*x – .01*y)*y-(400000 + 195*x + 225*y + r*(x + y)); z := ( 339 โˆ’ .01 x โˆ’ .003 y ) x + ( 399 โˆ’ .004 x โˆ’ .01 y ) y โˆ’ 400000 โˆ’ 195 x โˆ’ 225 y โˆ’ r ( x + y ) > dzdx:=diff(z,x); > dzdy:=diff(z,y); dzdx := โˆ’.02 x + 144. โˆ’ .007 y โˆ’ r dzdy := โˆ’.007 x โˆ’ .02 y + 174. โˆ’ r > solve({dzdx=0,dzdy=0},{x,y}); > assign(%); { y = 7042.735043 โˆ’ 37.03703704 r, x = 4735.042735 โˆ’ 37.03703704 r } > dzr:=diff(z,r); dzr := โˆ’11777.77778 + 74.07407414 r > assign(‘r=25’); > szr:=dzr*(r/z); szr := -.8788835876 Then S(z, r) = -0.88 and so if the tarriff goes up by 10% the company’s expected profits decrease by 8.8%. To motivate the company to relocate we have to decrease the expected profit from 282,000 to 204,000 which is a decline of 28%. This requires a tarriff increase of 32% to $33 per set. Since this is just an estimate, and since we want the US relocation to be a better option, not just an equally good option, we recommend setting the tarriff at $35 per set or more. (d) We have already calculated S(z, r) = -0.88 and the following calculations show that S(x, r) = -0.24 while S(y, r) = -0.15. Given that the only motivation of the tarriff is to induce the company to relocate to the US, we should set the tarriff as low as possible, given that the tarriff is large enough to motivate the move. So we recommend a tarriff of $35 per set. The only significant result of a tarriff higher than $35 is to lower company profits. > unassign(‘r’); > dxr:=diff(x,r);dyr:=diff(y,r); dxr := -37.03703704 dyr := -37.03703704 > assign(‘r=25’);sxr:=dxr*(r/x);syr:=dyr*(r/y); sxr := -.2430815258 syr := -.1513740103 6. (a) Step 1: Ask the question. Variables: p = price ($ / computer) s = sales (computers / month) a = advertising budget ($ / month) C = manufacturing cost ($ / month) R = revenue ($ / month) P = profit ($ / month) Assumptions: C = 700 s + a s = 10,000 + 5000 (950 – p) / 100 + 200 (a – 50000) / 10000 R=ps P =R-C p >= 0 and 0 <= a = 0 and 0 <= y unassign(‘x’,’y’); > z:= (x – 700)*(10000 + 5000*(950 – x) / 100 + 200*(y – 50000) / 10000) – y; ๏ฃซ 1 ๏ฃถ z := ( x โˆ’ 700 ) ๏ฃฌ๏ฃฌ 56500 โˆ’ 50 x + y ๏ฃท๏ฃท โˆ’ y ๏ฃญ 50 ๏ฃธ > plot3d(z, x=600..1200,y=0..100000,axes=framed); > dzdx:=diff(z,x); dzdx := 91500 โˆ’ 100 x + 1 50 y > dzdy:=diff(z,y); dzdy := 1 50 x โˆ’ 15 > solve({dzdx=0,dzdy=0},{x,y}); { x = 750, y = -825000 } Since the only point at which the gradient is zero is outside the feasible region, there are no local extrema in the interior. Now look along the constraint line g(x, y) = y = 100,000. Note that the gradient of g is (0,1). > solve({dzdx=0,dzdy=lambda,y=100000},{x,y,lambda}); { y = 100000, x = 935, ฮป = 37 10 } > assign(%); > z; 2661250 The maximum occurs when x = 935. At this point y = 100,000 and z = 2,661,250. Also the value of the Lagrange multiplier is 3.7. Note that setting y = 100,000 yields a quadratic function of x alone, and this is the vertex of that parabola, so this is the maximum on the line y = 100,000. The graph of f(x, y) is very flat in the y direction, but it is easy to see that z is negative for large x. On the line g(x, y) = y = 0 we similarly find > unassign(‘x’,’y’,’lambda’); > solve({dzdx=0,dzdy=lambda,y=0},{x,y,lambda}); > assign(%); { y = 0, ฮป = 33 , x = 915 } 10 > z; 2311250 that the maximum occurs at x = 915, y = 0, and z = 2,311,250 which is less than the maximum along y = 100,000. On the line g(x, y) = x = 0 we have gradient vector (1,0) and > unassign(‘x’,’y’,’lambda’); > assign(x=0); > dzdx; 91500 + 1 50 y > dzdy; -15 there are no relative extrema on this segment of the boundary. Since dz/dy < 0 the maximum on this segment occurs at the origin. At this point z = 0 and 0 <= y unassign(‘x’,’y’,’lambda’); > z:= (x – 700)*(10000 + e*(950 – x) + 200*(y – 50000) / 10000) – y; ๏ฃซ 1 ๏ฃถ z := ( x โˆ’ 700 ) ๏ฃฌ๏ฃฌ 9000 + e ( 950 โˆ’ x ) + y ๏ฃท๏ฃท โˆ’ y ๏ฃญ 50 ๏ฃธ > dzdx:=diff(z,x); > dzdy:=diff(z,y); dzdx := 9000 + e ( 950 โˆ’ x ) + 1 1 50 y โˆ’ ( x โˆ’ 700 ) e x โˆ’ 15 50 > solve({dzdx=0,dzdy=lambda,y=100000},{x,y,lambda}); dzdy := { y = 100000, ฮป = 1 220 + 3 e 2 e , x = 275 3 e + 20 e } > assign(%); > dxde:=diff(x,e); dxde := 825 1 e โˆ’ 275 ( 3 e + 20 ) e2 > assign(‘e=50’); > sxe:=dxde*(e/x); > evalf(%); > sxe := -2 17 -.1176470588 we find that S(x, e) = -0.117 and since we are on the constraint line y = 100,000 we have S(y, e) = 0. Both the optimal selling price and the optimal advertising expenditure are quite insensitive to the price elasticity e. If the effect of lowering price is 10% greater than expected (i.e. if lowering the price by $100 results in a 55% increase in sales) then the optimal selling price is about 1.1% lower than expected, and the optimal advertising budget stays the same. (c) Let n denote the number of new sales for each $10,000 increase in the ad budget. Currently we assume n = 200. Now z = f(x, y) = (x – 700) (10,000 + 50 (950 – x) + n (y – 50000) / 10000) – y and we need to maximize f(x, y) over the set of all (x, y) for which x >= 0 and 0 <= y unassign(‘x’,’y’,’lambda’); > z:= (x – 700)*(10000 +50*(950 – x) +n*(y – 50000) / 10000) – y; ๏ฃซ 1 ๏ฃถ z := ( x โˆ’ 700 ) ๏ฃฌ๏ฃฌ 57500 โˆ’ 50 x + n ( y โˆ’ 50000 ) ๏ฃท๏ฃท โˆ’ y ๏ฃญ 10000 ๏ฃธ > dzdx:=diff(z,x); > dzdy:=diff(z,y); dzdx := 92500 โˆ’ 100 x + 1 10000 n ( y โˆ’ 50000 ) 1 ( x โˆ’ 700 ) n โˆ’ 1 10000 > solve({dzdx=0,dzdy=lambda,y=100000},{x,y,lambda}); dzdy := { y = 100000, ฮป = โˆ’1 + > assign(%); > dxdn:=diff(x,n); > assign(‘n=200’); 9 400 n+ 1 200000 n2, x = 925 + 1 20 n} > sxn:=dxdn*(n/x); > evalf(%); dxdn := sxn := 1 20 2 187 .01069518717 we find that S(x, e) = -0.01 and since we are on the constraint line y = 100,000 we have S(y, e) = 0. Both the optimal selling price and the optimal advertising expenditure are quite insensitive to n. Overall, the decision to leave the price at around $950 and to increase the advertising budget to $100,000 seems nearly optimal regardless of the true value of n and e, assuming they are at least close to what we have assumed. (d) The value of the Lagrange multiplier was 3.7 which means that every $1 increase in the advertising budget should result in about $3.70 in additional profits. Management should probably consider a larger advertising budget, assuming that the effect of advertising is as great as the ad agency claims. 7. (a) Step 1: Ask the question. Variables: p = subscription price ($ / paper) a = advertising price ($ / page) s = advertising sales (pages) c = circulation (papers) R = weekly revenue ($) Assumptions: s = 350 + 50 (250 – a) / 100 c = 80,000 + 5000 (1.50 – p) / 0.10 + 1000 (s – 350) / 50 R=pc+as p >= 0, a >= 0 Objective: Maximize R. Step 2: Select the modeling approach. We will model this problem as a multivariable unconstrained optimization problem. See text p. 23. Step 3: Formulate the model. Let x = p, y = a, and z = R, and write z = f(x, y) = x (80,000 + 5000 (1.50 – x) / 0.10 + 1000 (50 (250 – y) / 100) / 50) + y (350 + 50 (250 – y) / 100) Our goal is to maximize f(x, y) over the set of all (x, y) for which x >= 0 and y >= 0. Step 4: Solve the model. > unassign(‘x’,’y’); > z:=x*(80000+5000*(1.50-x)/0.10+1000*(50*(250-y)/100)/50)+y*(350+50 *(250-y)/100); ๏ฃซ 1 ๏ฃถ z := x ( 157500.0000 โˆ’ 50000.00000 x โˆ’ 10 y ) + y ๏ฃฌ๏ฃฌ 475 โˆ’ y ๏ฃท๏ฃท ๏ฃญ 2 ๏ฃธ > plot3d(z, x=0..3,y=0..500,axes=framed); > dzdx:=diff(z,x); dzdx := 157500.0000 โˆ’ 100000.0000 x โˆ’ 10 y > dzdy:=diff(z,y); dzdy := โˆ’10 x + 475 โˆ’ y > solve({dzdx=0,dzdy=0},{x,y}); { x = 1.529029029, y = 459.7097097 } > assign(%); > z; 229592.0921 The graph indicates a unique maximum at the point where the gradient is zero. We calculate that this occurs when x = 1.53, y = 459.71 and z = 229,592.10. Step 5. Our model suggests that we leave the subscription price at $1.50 per week and raise the advertising price to around $450 per page. This should result in weeky revenue (profit) of around $230,000. (b) We generalize the model from part (a) and assume that a 10 cent increase in subscription price results in n lost sales, where currently n = 5000. > unassign(‘x’,’y’,’n’); > z:=x*(80000+n*(1.50-x)/0.10+1000*(50*(250-y)/100)/50)+y*(350+50*(2 50-y)/100); ๏ฃซ 1 ๏ฃถ z := x ( 82500 + 10.00000000 n ( 1.50 โˆ’ x ) โˆ’ 10 y ) + y ๏ฃฌ๏ฃฌ 475 โˆ’ y ๏ฃท๏ฃท ๏ฃญ 2 ๏ฃธ > dzdx:=diff(z,x); > dzdy:=diff(z,y); dzdx := 82500 + 10.00000000 n ( 1.50 โˆ’ x ) โˆ’ 10 y โˆ’ 10.00000000 n x dzdy := โˆ’10 x + 475 โˆ’ y > solve({dzdx=0,dzdy=0},{x,y}); > assign(%); { x = .2500000000 15550. + 3. n n โˆ’ 5. , y = 27.50000000 โˆ’1500. + 17. n n โˆ’ 5. } > z; ๏ฃซ .2500000000 ( 15550. + 3. n ) ๏ฃฌ๏ฃฌ ๏ฃญ ๏ฃซ .2500000000 ( 15550. + 3. n ) ๏ฃถ 275.0000000 ( โˆ’1500. + 17. n ) ๏ฃท๏ฃท โˆ’ 82500 + 10.00000000 n ๏ฃฌ๏ฃฌ 1.50 โˆ’ ๏ฃญ n โˆ’ 5. ๏ฃธ n โˆ’ 5. ๏ฃซ 13.75000000 ( โˆ’1500. + 17. n ) ๏ฃถ ๏ฃท๏ฃท 27.50000000 ( โˆ’1500. + 17. n ) ๏ฃฌ๏ฃฌ 475 โˆ’ ๏ฃญ n โˆ’ 5. ๏ฃธ ๏ฃถ ๏ฃท๏ฃท / ( n โˆ’ 5. ) + ๏ฃธ > dxdn:=diff(x,n): > dydn:=diff(y,n): > dzdn:=diff(z,n): > assign(n=5000); > sxn:=dxdn*(n/x); n โˆ’ 5. sxn := -.5100026378 > syn:=dydn*(n/y); syn := .01696307090 > szn:=dzdn*(n/z); szn := -.009666323346 Then S(x, n) = -0.51, S(y, n) = +0.017, and S(z, n) = -0.01 so that only the optimal subscription price is sensitive to this parameter. For example, if a 10 cent increase in subscription price actually results in a loss of 6000 subscriptions (20% more than expected) then the optimal subscription price should be about 11% lower than the calculated optimum of 1.53, or around $1.35. (c) We generalize the model from part (a) and assume that a $100 per page increase in the price of advertising results in m pages per week of lost sales, where currently m = 50. > unassign(‘x’,’y’,’m’); > z:=x*(80000+5000*(1.50-x)/0.10+1000*(m*(250-y)/100)/50)+y*(350+m*( 250-y)/100); ๏ฃซ 1 ๏ฃถ ๏ฃซ 1 ๏ฃถ z := x ๏ฃฌ๏ฃฌ 155000.0000 โˆ’ 50000.00000 x + m ( 250 โˆ’ y ) ๏ฃท๏ฃท + y ๏ฃฌ๏ฃฌ 350 + m ( 250 โˆ’ y ) ๏ฃท๏ฃท ๏ฃญ 5 ๏ฃธ ๏ฃญ 100 ๏ฃธ > dzdx:=diff(z,x); > dzdy:=diff(z,y); dzdx := 155000.0000 โˆ’ 100000.0000 x + 1 5 m ( 250 โˆ’ y ) 1 1 1 dzdy := โˆ’ x m + 350 + m ( 250 โˆ’ y ) โˆ’ ym 5 100 100 > solve({dzdx=0,dzdy=0},{x,y}); { y = 250. โˆ’21900. m โˆ’ .3500000 107 + m2 m ( m โˆ’ 50000. ) , x = โˆ’12.50000000 6060. + m m โˆ’ 50000. } > assign(%); > z; ๏ฃซ โˆ’12.50000000 ( 6060. + m ) ๏ฃฌ๏ฃฌ ๏ฃญ 155000.0000 + 625000.0000 ( 6060. + m ) m โˆ’ 50000. ๏ฃซ 250. ( โˆ’21900. m โˆ’ .3500000 107 + m2 ) ๏ฃถ ๏ฃฌ ๏ฃท๏ฃท + m ๏ฃฌ 250 โˆ’ 5 ๏ฃญ m ( m โˆ’ 50000. ) ๏ฃธ 1 ๏ฃถ ๏ฃท๏ฃท / ( m โˆ’ 50000. ) + 250. ( โˆ’21900. m โˆ’ .3500000 107 + m2 ) ๏ฃธ ๏ฃซ ๏ฃซ 1 250. ( โˆ’21900. m โˆ’ .3500000 107 + m2 ) ๏ฃถ ๏ฃถ ๏ฃฌ๏ฃฌ 350 + ๏ฃฌ ๏ฃท๏ฃท ๏ฃท๏ฃท / ( m ( m โˆ’ 50000. ) ) m ๏ฃฌ 250 โˆ’ ๏ฃญ ๏ฃธ๏ฃธ 100 ๏ฃญ m ( m โˆ’ 50000. ) > dxdm:=diff(x,m): > dydm:=diff(y,m): > dzdm:=diff(z,m): > assign(m=50); > sxm:=dxdm*(m/x); > sym:=dydm*(m/y); > szm:=dzdm*(m/z); sxm := .009184307056 sym := -.7616555042 szm := -.2239158881 Then S(x, m) = +0.01, S(y, m) = -0.76, and S(z, m) = -0.22 so that both the optimal ad price and the optimal revenue (profit) are sensitive to this parameter, but the optimal subscription price is not. If the negative reaction to an increase in ad prices is 10% greater than expected, then ad sales will be 7.6% lower than expected and total revenue will be 2.2% lower than expected. (d) In order to prevent advertisers from switching to direct mail, we might want to charge less than the optimum of $450 per page, which is close to the $500 per page direct mail charge. See problem 8 below for the case where we only raise the ad price to $400 per page. 8. (a) Step 1 is the same as problem 7 above, except that now we assume that the advertising price a = 0 and 0 <= y unassign(‘x’,’y’,’lambda’); > z:=x*(80000+5000*(1.50-x)/0.10+1000*(50*(250-y)/100)/50)+y*(350+50 *(250-y)/100); ๏ฃซ 1 ๏ฃถ z := x ( 157500.0000 โˆ’ 50000.00000 x โˆ’ 10 y ) + y ๏ฃฌ๏ฃฌ 475 โˆ’ y ๏ฃท๏ฃท ๏ฃญ 2 ๏ฃธ > dzdx:=diff(z,x); > dzdy:=diff(z,y); dzdx := 157500.0000 โˆ’ 100000.0000 x โˆ’ 10 y dzdy := โˆ’10 x + 475 โˆ’ y > solve({dzdx=0,dzdy=lambda,y=400},{x,y,lambda}); > assign(%); { y = 400., x = 1.535000000, ฮป = 59.65000000 } > z; 227811.2500 so that the maximum on this segment of the boundary occurs at x = 1.54, y = 400, and z = 227,811. The value of the Lagrange multiplier is 59.65. On g(x, y) = y = 0 we find > unassign(‘x’,’y’,’lambda’); > solve({dzdx=0,dzdy=lambda,y=0},{x,y,lambda}); { y = 0., x = 1.575000000, ฮป = 459.2500000 } > assign(%); > z; 124031.2500 a maximum at x = 1.575, y = 0, z = 124031 and on the line g(x, y) = x = 0 we find > unassign(‘x’,’y’,’lambda’); > solve({dzdx=lambda,dzdy=0,x=0},{x,y,lambda}); > assign(%); { y = 475., ฮป = 152750., x = 0. } > z; 112812.5000 a maximum at x = 0, y = 475, z = 112813. Since z unassign(‘x’,’y’,’n’,’lambda’); > z:=x*(80000+n*(1.50-x)/0.10+1000*(50*(250-y)/100)/50)+y*(350+50*(2 50-y)/100); ๏ฃซ 1 ๏ฃถ z := x ( 82500 + 10.00000000 n ( 1.50 โˆ’ x ) โˆ’ 10 y ) + y ๏ฃฌ๏ฃฌ 475 โˆ’ y ๏ฃท๏ฃท ๏ฃญ 2 ๏ฃธ > dzdx:=diff(z,x); > dzdy:=diff(z,y); dzdx := 82500 + 10.00000000 n ( 1.50 โˆ’ x ) โˆ’ 10 y โˆ’ 10.00000000 n x dzdy := โˆ’10 x + 475 โˆ’ y > solve({dzdx=0,dzdy=lambda,y=400},{x,y,lambda}); { y = 400., x = .2500000000 15700. + 3. n n , ฮป = 2.500000000 โˆ’15700. + 27. n > assign(%); > dxdn:=diff(x,n); > dydn:=diff(y,n); dxdn := โˆ’.2500000000 15700. + 3. n n2 dydn := 0 > assign(n=5000); > sxn:=dxdn*(n/x); > syn:=dydn*(n/y); + .7500000000 n n } sxn := -.5114006515 syn := 0. Then S(x, n) = -0.51, and S(y, n) = 0 so that only the optimal subscription price is sensitive to this parameter. For example, if a 10 cent increase in subscription price actually results in a loss of 6000 subscriptions (20% more than expected) then the optimal subscription price should be about 11% lower than the calculated optimum of 1.54, or around $1.35. (c) We generalize the model from part (a) and assume that a $100 per page increase in the price of advertising results in m pages per week of lost sales, where currently m = 50. > unassign(‘x’,’y’,’m’,’lambda’); > z:=x*(80000+5000*(1.50-x)/0.10+1000*(m*(250-y)/100)/50)+y*(350+m*( 250-y)/100); ๏ฃซ 1 ๏ฃถ ๏ฃซ 1 ๏ฃถ z := x ๏ฃฌ๏ฃฌ 155000.0000 โˆ’ 50000.00000 x + m ( 250 โˆ’ y ) ๏ฃท๏ฃท + y ๏ฃฌ๏ฃฌ 350 + m ( 250 โˆ’ y ) ๏ฃท๏ฃท ๏ฃญ 5 ๏ฃธ ๏ฃญ 100 ๏ฃธ > dzdx:=diff(z,x); > dzdy:=diff(z,y); dzdx := 155000.0000 โˆ’ 100000.0000 x + 1 5 m ( 250 โˆ’ y ) 1 1 1 dzdy := โˆ’ x m + 350 + m ( 250 โˆ’ y ) โˆ’ ym 5 100 100 > solve({dzdx=0,dzdy=lambda,y=400},{x,y,lambda}); > assign(%); > { y = 400., ฮป = 350. โˆ’ 5.810000000 m + .00006000000000 m2, x = 1.550000000 โˆ’ .0003000000000 m } > dxdm:=diff(x,m); dxdm := -.0003000000000 > assign(m=50); > sxm:=dxdm*(m/x); sxm := -.009771986971 Then S(x, m) = -0.01, and of course S(y, m) = 0 so that neither decision variable is sensitive to the exact magnitude of negative reaction to an increase in ad prices. This makes intuitive sense since we have deliberately cushioned against this negative impact. (d) The value of the Lagrange multiplier is 59.65. This is also the derivative of total weekly revenue z ($) with respect to the upper bound c on ad prices, where currently we assume c = 400 ($ / page). For example, if we raise this upper bound by $10 per page then revenue would increase by $596.50 per week. This loss protects the newspaper against a potential loss in advertising to the direct mail competition. Roughly speaking, every $1 drop in advertising price costs the company $60 in profits. 9. (a) Step 1: Ask the question. Variables: s = advertising sales (pages) c = circulation (papers) E = weekly editorial expense ($) B = weekly sales budget ($) R = weekly revenue ($) C = weekly cost ($) P = weekly profit ($) Assumptions: s = 350 + (.01*350) (E – 80,000) / 8,000 + (0.15*350) (B – 30,000) / 6000 c = 80,000 + (.02*80,000) (E – 80,000) / 8,000 R = 1.50 c + 250 s C = E + B + 90,000 P=R-C 40,000 <= E <= 80,000 30,000 <= B <= 50,000 C <= 200,000 Objective: Maximize P. Step 2: Select the modeling approach. We will model this problem as a multivariable constrained optimization problem, and we will solve the problem using the method of Lagrange multipliers. See text p. 33. Step 3: Formulate the model. Let x = E, y = B, and z = P, and write z = f(x, y) = 1.50 (80,000 + (.02*80,000) (x – 80,000) / 8,000) + 250 (350 + (.01*350) (x – 80,000) / 8,000 + (0.15*350) (y – 30,000) / 6000 ) – (x + y + 90,000) Our goal is to maximize f(x, y) over the set S of all (x, y) for which 40,000 <= x <= 80,000 30,000 <= y <= 50,000 x + y unassign(‘x’,’y’); > z:=1.50*(80000+(.02*80000)*(x-80000)/8000) +250*(350+(.01*350)*(x-80000)/8000+(0.15*350)*(y-30000)/6000)-(x+y +90000); z := 19125.0000 โˆ’ .5906250000 x + 1.187500000 y > assign({x=40000,y=30000});z; 31125.00000 > unassign(‘x’,’y’);assign({x=40000,y=50000});z; 54875.00000 > unassign(‘x’,’y’);assign({x=80000,y=30000});z; 7500.00000 > unassign(‘x’,’y’);assign({x=60000,y=50000});z; 43062.50000 The maximum occurs at (x, y) = (40000, 50000) where z = 54875. Step 5. We recommend cutting editorial expense to $40,000 and increasing the ad budget to $50,000 per week. This should increase profits dramatically from their current level of $7,500 per week to around $55,000 per week. (b) The binding constraints are g1(x,y) = x = 40,000 and g2(x,y) = y = 50,000. The gradient vectors are (1,0) and (0,1) respectively, and so the Lagrange multiplier equation is (dz/dx,dz/dy) = lambda1 (1,0) + lambda2 (0,1). At the optimum we have lambda1 = -0.59 and lambda2 = 1.1875. All other things being equal, a change in the maximum ad budget from 50,000 to 50,001 would net the company $1.19. All other things being equal, a change in the minimum editorial budget from 40,000 to 40,001 would cost the company 59 cents. The effects are additive, so that if the ad budget is increased by one dollar and the editorial budget is decreased by one dollar, then the change in net profit is 1.19 + 0.59 = 1.78 dollars. The constraints which give lower bounds on the ad budget, upper bounds on the editorial budget, and upper bounds on the total budget are not binding, and so their associated shadow prices are zero. Small changes in these figures will not effect net profit. (c) The feasible region is the rectangle defined by 40,000 <= x <= 80,000 30,000 <= y <= 50,000 intersected with the half-plane x + y unassign(‘x’,’y’); > z:=1.50*(80000+(2*p*80000)*(x-80000)/8000) +250*(350+(p*350)*(x-80000)/8000+(0.15*350)*(y-30000)/6000)-(x+y+9 0000); z := 51875.0000 + 40.93750000 p ( x โˆ’ 80000 ) + 1.187500000 y โˆ’ x > assign({x=40000,y=30000});z1:=z; z1 := 47500.00000 โˆ’ .1637500000 107 p > unassign(‘x’,’y’);assign({x=40000,y=50000});z2:=z; z2 := 71250.0000 โˆ’ .1637500000 107 p > unassign(‘x’,’y’);assign({x=80000,y=30000});z3:=z; z3 := 7500.00000 > unassign(‘x’,’y’);assign({x=60000,y=50000});z4:=z; z4 := 51250.0000 โˆ’ 818750.0000 p > solve({z2=z4},{p}); { p = .02442748092 } > solve({z3=z4},{p}); { p = .05343511450 } > plot({z2,z4},p=0..0.04); and note that z2 > z1 for any p. Then if p 0.024 then it is optimal to cut the editorial budget to $60,000 per week. It is never optimal to maintain the editorial budget at its current level of $80,000 per week. Geometrically, the optimum occurs where the level set z = c crosses the feasible region for the largest value of c. For p 0.024 this is a line with a negative slope. Increasing c > 0 moves the line upward. Thus the only possible maxima for any p > 0 are the upper corner points of the feasible region. 10. (a) Step 1: Ask the question. Variables: x1 = cargo 1 (tons) x2 = cargo 2 (tons) x3 = cargo 3 (tons) W = total weight (tons) V = total volume (cubic feet) T = total freight charges ($) Assumptions: W = x1 + x2 + x3 V = 550 x1 + 800 x2 + 400 x3 T = 250 W W <= 100 V <= 50,000 0 <= x1 <= 30 0 <= x2 <= 40 0 <= x3 <= 50 Objective: Maximize T. Step 2: Select the modeling approach. We will model this problem as a multivariable constrained optimization problem, and we will solve the problem using the method of Lagrange multipliers. See text p. 33. Step 3: Formulate the model. Let z = T, and write z = f(x1, x2, x3) = 250 x1 + 250 x2 + 250 x3 Our goal is to maximize f(x, y) over the set S of all (x, y) for which x1 + x2 + x3 <= 100 550 x1 + 800 x2 + 400 x3 <= 50,000 0 <= x1 <= 30 0 <= x2 <= 40 0 <= x3 unassign(‘x1′,’x2′,’x3’); > solve({550*x1+800*x2+400*x3=50000,x1=30,x3=50},{x1,x2,x3});evalf(% ); { x1 = 30, x3 = 50, x2 = 135 8 } { x1 = 30., x3 = 50., x2 = 16.87500000 } > assign(%);z:=250*x1+250*x2+250*x3; z := 24218.75000 Step 5. The optimal strategy is to ship the maximum of 30 tons/day of cargo 1 and 50 tons/day of cargo 3. Then because of volume constraints we can only ship 16.875 tons/day of cargo 2. This will yield a total shipping charge of $24,218.75 per day. The weight constraint is not binding, i.e. we do not have enough volume in the cargo holds to ship all 100 tons of available cargo. (b) The gradient vectors for the binding constraints are v2 = (550, 800, 400) for g2, v3 = (1,0,0) for g3, v5 = (0,0,1) for g5, and w = (250, 250, 250) for the objective function f. The Lagrange multiplier equations are w = lambda2 v2 + lambda3 v3 + lambda5 v5. > solve({250=lambda2*550+lambda3,250=lambda2*800,250=lambda2*400+lam bda5},{lambda2,lambda3,lambda5}); { ฮป2 = 5 16 , ฮป5 = 125, ฮป3 = 625 8 } > evalf(%); { ฮป2 = .3125000000, ฮป5 = 125., ฮป3 = 78.12500000 } so that lambda2 = 0.3125, lambda3 = 78.125, and lambda5 = 125. Additional cargo capacity is worth $0.31 per cubic foot. The net advantadge of being able to ship more of cargo 1 is $78.13 per ton, and for cargo 3 the figure is $125 per ton. For all of the other constraints, which are all nonbinding, the shadow prices are zero. So for example the company would not be willing to pay to increase the weight capacity of the planes, since the current optimal solution does not use all of the available weight capacity. (c) Using the sensitivity results from part (b) above, we know that additional cargo space is worth $0.31 per cubic foot. Over the useful lifetime of the planes, the proposed modification would allow the company to ship 5*250*2000=2,500,000 additional cubic feet of cargo, which should be worth 0.31*2,500,000 = 775,000 dollars. This is well above the $200,000 cost of the reconfiguration, so the company should proceed with the plan. The remaining cargo not currently being shipped consists of 40 – 16.875 = 23.125 tons per day of cargo 2, which would fill a volume of 23.125*800 = 18500 cubic feet. Our currrent daily load uses all of the available volume and weighs 96.875 tons. Each modified plane can carry an additional 2000 cubic feet of cargo 2, which weighs 2000/800 = 2.5 tons. Although there is enough additional cargo to fill 9 or 10 modified planes, there is only enough total weight capacity to carry an additional 3.125 tons per day, so we should only modify one or two of the planes. If we modify one plane then the binding constraints are g3, g5, and the modified constraint g2 unassign(‘x1′,’x2′,’x3’); > solve({550*x1+800*x2+400*x3=52000,x1=30,x3=50},{x1,x2,x3});evalf(% ); > { x2 = 155 8 , x1 = 30, x3 = 50 } { x2 = 19.37500000, x3 = 50., x1 = 30. } > assign(%);z:=250*x1+250*x2+250*x3; z := 24843.75000 and so in this case we ship 19.375 tons of cargo 2 and obtain $24,843.75 per day in shipping charges. If we modify 2 planes then g3, g5, and g1 unassign(‘x1′,’x2′,’x3’); > solve({x1+x2+x3=100,x1=30,x3=50},{x1,x2,x3}); { x2 = 20, x1 = 30, x3 = 50 } > assign(%);z:=250*x1+250*x2+250*x3; z := 25000 > and so in this case we ship 20 tons of cargo 2 and obtain $25,000 per day in shipping charges. The difference between two planes and one is (25000-24843.75)*5*200 = 156,250 dollars over the five year lifetime of the planes, and this is less than the $200,000 alteration charge, so it is not worth while to modify both planes.

Document Preview (40 of 375 Pages)

User generated content is uploaded by users for the purposes of learning and should be used following SchloarOn's honor code & terms of service.
You are viewing preview pages of the document. Purchase to get full access instantly.

Shop by Category See All


Shopping Cart (0)

Your bag is empty

Don't miss out on great deals! Start shopping or Sign in to view products added.

Shop What's New Sign in