Solution Manual For Managing, Controlling, and Improving Quality, 1st Edition

Preview Extract
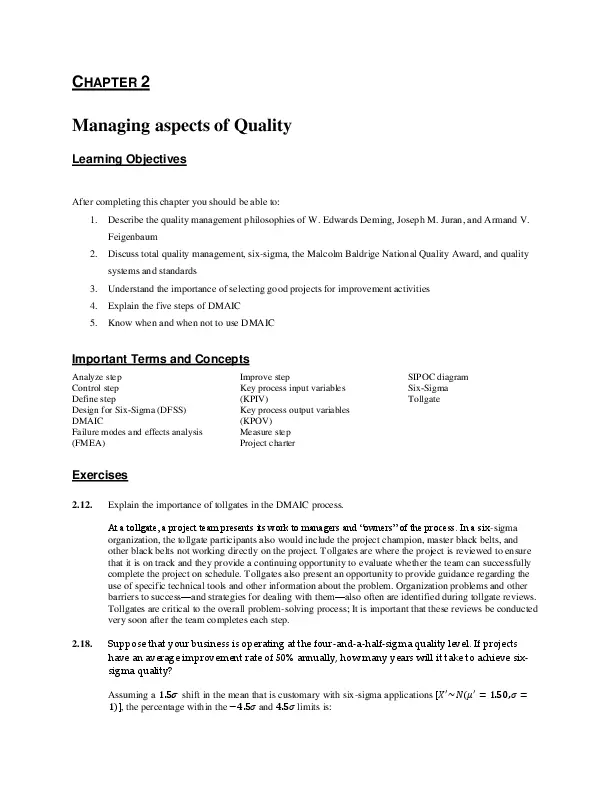
CHAPTER 2 Managing aspects of Quality Learning Objectives After completing this chapter you should be able to: 1. Describe the quality management philosophies of W. Edwards Deming, Joseph M. Juran, and Armand V. Feigenbaum 2. Discuss total quality management, six-sigma, the Malcolm Baldrige National Quality Award, and quality systems and standards 3. Understand the importance of selecting good projects for improvement activities 4. Explain the five steps of DMAIC 5. Know when and when not to use DMAIC Important Terms and Concepts Analyze step Control step Define step Design for Six-Sigma (DFSS) DMAIC Failure modes and effects analysis (FMEA) Improve step Key process input variables (KPIV) Key process output variables (KPOV) Measure step Project charter SIPOC diagram Six-Sigma Tollgate Exercises 2.12. Explain the importance of tollgates in the DMAIC process. At a tollgate, a project team presents its work to managers and โ€œownersโ€ of the process. In a six-sigma organization, the tollgate participants also would include the project champion, master black belts, and other black belts not working directly on the project. Tollgates are where the project is reviewed to ensure that it is on track and they provide a continuing opportunity to evaluate whether the team can successfully complete the project on schedule. Tollgates also present an opportunity to provide guidance regarding the use of specific technical tools and other information about the problem. Organization problems and other barriers to successโ€”and strategies for dealing with themโ€”also often are identified during tollgate reviews. Tollgates are critical to the overall problem-solving process; It is important that these reviews be conducted very soon after the team completes each step. 2.18. Suppose that your business is operating at the four-and-a-half-sigma quality level. If projects have an average improvement rate of 50% annually, how many years will it take to achieve sixsigma quality? Assuming a 1.5๏ณ shift in the mean that is customary with six-sigma applications [? โ€ฒ ~?(? โ€ฒ = 1.50, ? = 1)], the percentage within the โˆ’4.5? and 4.5? limits is: ?(โˆ’4.5 โ‰ค ? โ€ฒ โ‰ค 4.5) = ?(? โ€ฒ โ‰ค 4.5) โˆ’ ?(? โ€ฒ โ‰ค โˆ’4.5) =0.9987 Then, the ??? defective is: (1 โˆ’ 0.9987) โˆ— 106 โ‰ˆ 1,350. Using the equation in Example 2.1: 3.4 = 1,350 โˆ— (1 โˆ’ 0.5) ? 3.4 ? = ?? ( )โ„??(1 โˆ’ 0.5) 1,350 ? = 8.6332 ` It will take the business nearly 8 years and 7 months to achieve 6? quality. 2.19. Explain why it is important to separate sources of variability into special or assignable causes and common or chance causes. Common or chance causes are due to the inherent variability in the system and cannot generally be controlled. Special or assignable causes can be discovered and removed, thus reducing the variability in the overall system. It is important to distinguish between the two types of variability, because the strategy to reduce variability depends on the source. Chance cause variability can only be removed by changing the system, while assignable cause variability can be addressed by finding and eliminating the assignable causes. 2.21. Suppose that during the analyze phase an obvious solution is discovered. Should that solution be immediately implemented and the remaining steps of DMAIC abandoned? Discuss your answer. The answer is generally NO. The advantage of completing the rest of the DMAIC process is that the solution will be documented, tested, and itโ€™s applicability to other parts of the business will be evaluated. An immediate implementation of an โ€œobviousโ€ solution may not lead to an appropriate control plan. Completing the rest of DMAIC process can also lead to further refinements and improvements to the solution. Also the transition plan developed in the control phase includes a validation check several months after project completion, if the DMAIC process is not completed; there is a danger of the original results not being sustained. CHAPTER 3 Tools and Techniques for Quality Control and Improvement Learning Objectives After completing this chapter you should be able to: 1. Understand chance and assignable causes of variability in a process 2. Explain the statistical basis of the Shewhart control chart 3. Understand the basic process improvement tools of SPC: the histogram or stem-and-leaf plot, the check sheet, the Pareto chart, the cause-and-effect diagram, the defect concentration diagram, the scatter diagram, and the control chart 4. Explain how sensitizing rules and pattern recognition are used inconjunction with control charts Important Terms and Concepts Action limits Assignable causes of variation Cause-and-effect diagram Chance causes of variation Check sheet Control chart Control limits Defect concentration diagram Designed experiments Flow charts, operations process charts, and value stream mapping Factorial experiment In-control process Magnificent seven Out-of-control-action plan (OCAP) Out-of-control process Pareto chart Patterns on control charts Scatter diagram Shewhart control charts Statistical control of a process Statistical process control (SPC) Three-sigma control limits Exercises 3.6. Consider the control charts shown here. Does the pattern appear random? No, the last four samples are located at a distance greater than 1๏ณ from the center line. 3.7. Consider the control charts shown here. Does the pattern appear random? Yes, the pattern is random. 3.8. Consider the control charts shown here. Does the pattern appear random? Yes, the pattern is random.

Document Preview (5 of 113 Pages)

User generated content is uploaded by users for the purposes of learning and should be used following SchloarOn's honor code & terms of service.
You are viewing preview pages of the document. Purchase to get full access instantly.

Shop by Category See All


Shopping Cart (0)

Your bag is empty

Don't miss out on great deals! Start shopping or Sign in to view products added.

Shop What's New Sign in