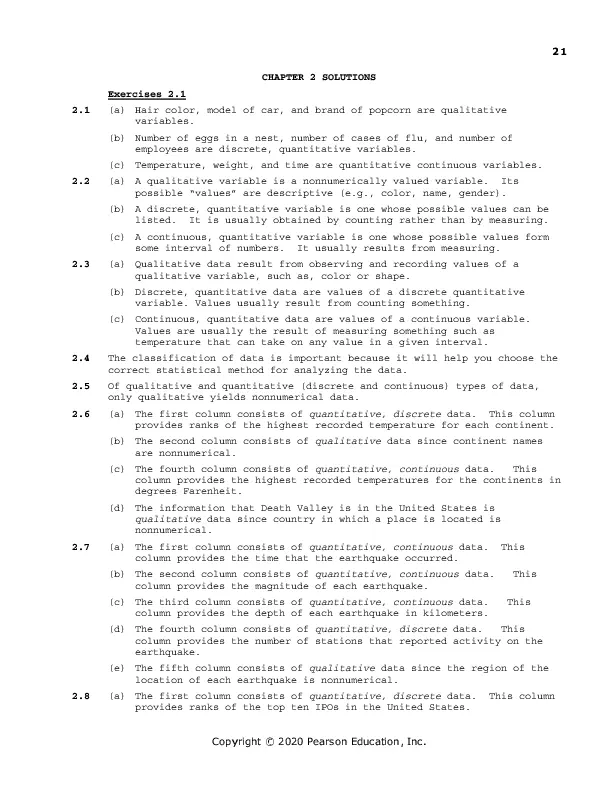
Solution Manual for Introductory Statistics, 10th Edition

Preview Extract
21 CHAPTER 2 SOLUTIONS Exercises 2.1 2.1 (a) Hair color, model of car, and brand of popcorn are qualitative variables. (b) Number of eggs in a nest, number of cases of flu, and number of employees are discrete, quantitative variables. (c) Temperature, weight, and time are quantitative continuous variables. 2.2 (a) A qualitative variable is a nonnumerically valued variable. Its possible โ€œvaluesโ€ are descriptive (e.g., color, name, gender). (b) A discrete, quantitative variable is one whose possible values can be listed. It is usually obtained by counting rather than by measuring. (c) A continuous, quantitative variable is one whose possible values form some interval of numbers. It usually results from measuring. 2.3 (a) Qualitative data result from observing and recording values of a qualitative variable, such as, color or shape. (b) Discrete, quantitative data are values of a discrete quantitative variable. Values usually result from counting something. (c) Continuous, quantitative data are values of a continuous variable. Values are usually the result of measuring something such as temperature that can take on any value in a given interval. 2.4 The classification of data is important because it will help you choose the correct statistical method for analyzing the data. 2.5 Of qualitative and quantitative (discrete and continuous) types of data, only qualitative yields nonnumerical data. 2.6 (a) The first column consists of quantitative, discrete data. This column provides ranks of the highest recorded temperature for each continent. (b) The second column consists of qualitative data since continent names are nonnumerical. (c) The fourth column consists of quantitative, continuous data. This column provides the highest recorded temperatures for the continents in degrees Farenheit. (d) The information that Death Valley is in the United States is qualitative data since country in which a place is located is nonnumerical. 2.7 (a) The first column consists of quantitative, continuous data. column provides the time that the earthquake occurred. This (b) The second column consists of quantitative, continuous data. column provides the magnitude of each earthquake. This (c) The third column consists of quantitative, continuous data. column provides the depth of each earthquake in kilometers. This (d) The fourth column consists of quantitative, discrete data. This column provides the number of stations that reported activity on the earthquake. (e) The fifth column consists of qualitative data since the region of the location of each earthquake is nonnumerical. 2.8 (a) The first column consists of quantitative, discrete data. provides ranks of the top ten IPOs in the United States. Copyright ยฉ 2020 Pearson Education, Inc. This column 22 Chapter 2 (b) The second column consists of qualitative data since company names are nonnumerical. (c) The third column consists of quantitative, discrete data. Since money involves discrete units, such as dollars and cents, the data is discrete, although, for all practical purposes, this data might be considered quantitative continuous data. (d) The information that Facebook is a social networking business is qualitative data since type of business is nonnumerical. 2.9 (a) The first column consists of quantitative, discrete data. This column provides the ranks of the deceased celebrities with the top 10 earnings. (b) The second column consists of qualitative data since names are nonnumerical. (c) The third column consists of quantitative, discrete data, the earnings of the celebrities. Since money involves discrete units, such as dollars and cents, the data is discrete, although, for all practical purposes, this data might be considered quantitative continuous data 2.10 (a) The first column consists of quantitative, discrete data. This column provides the ranks of the top 10 universities for 2012-2013. (b) The second column consists of qualitative data since names of the institutions are nonnumerical. (c) The third column consists of quantitative, continuous data. This column provides the overall score of the top 10 universities for 20122013. 2.11 (a) The first column contains types of products. since they are nonnumerical. They are qualitative data (b) The second column contains number of units shipped in the millions. These are whole numbers and are quantitative, discrete. (c) The third column contains money values. Technically, these are quantitative, discrete data since there are gaps between possible values at the cent level. For all practical purposes, however, these are quantitative, continuous data. 2.12 Player name, team, and position are nonnumerical and are therefore qualitative data. The number of runs batted in, or RBI, are whole numbers and are therefore quantitative, discrete. Weight is quantitative, continuous. 2.13 The first column contains quantitative, discrete data in the form of ranks. These are whole numbers. The second and third columns contain qualitative data in the form of names. The last column contains the rating of the program which is quantitative, continuous. 2.14 The first column is qualitative since it is nonnumerical. The second and third columns are quantitative, discrete since they report the number of grants and applications received. The last column is quantitative, continuous since it reports the success rate of the grants. 2.15 The first column is quantitative, discrete since it is reporting a rank. The second and third columns are qualitative since make/model and type are nonnumerical. The last column is quantitative, continuous since it is reporting mileage. 2.16 Of the eight items presented, only high school class rank involves ordinal data. The rank is ordinal data. Copyright ยฉ 2020 Pearson Education, Inc. Section 2.2 Exercises 23 2.2 2.17 A frequency distribution of qualitative data is a table that lists the distinct values of data and their frequencies. It is useful to organize the data and make it easier to understand. 2.18 (a) The frequency of a class is the number of observations in the class, whereas, the relative frequency of a class is the ratio of the class frequency to the total number of observations. (b) The percentage of a class is 100 times the relative frequency of the class. Equivalently, the relative frequency of a class is the percentage of the class expressed as a decimal. 2.19 (a) True. Having identical frequency distributions implies that the total number of observations and the numbers of observations in each class are identical. Thus, the relative frequencies will also be identical. (b) False. Having identical relative frequency distributions means that the ratio of the count in each class to the total is the same for both frequency distributions. However, one distribution may have twice (or some other multiple) the total number of observations as the other. For example, two distributions with counts of 5, 4, 1 and 10, 8, 2 would be different, but would have the same relative frequency distribution. (c) If the two data sets have the same number of observations, either a frequency distribution or a relative-frequency distribution is suitable. If, however, the two data sets have different numbers of observations, using relative-frequency distributions is more appropriate because the total of each set of relative frequencies is 1, putting both distributions on the same basis for comparison. 2.20 (a)-(b) The classes are presented in column 1. The frequency distribution of the classes is presented in column 2. Dividing each frequency by the total number of observations, which is 5, results in each class’s relative frequency. The relative frequency distribution is presented in column 3. Relative Frequency Class Frequency A 2 0.40 B 2 0.40 C 1 0.20 5 1.00 Copyright ยฉ 2020 Pearson Education, Inc. 24 Chapter 2 (c) We multiply each of the relative frequencies by 360 degrees to obtain the portion of the pie represented by each class. The result using Minitab is Pie Chart Category A B C C 20.0% A 40.0% B 40.0% (d) We use the bar chart to show the relative frequency with which each class occurs. The result is Bar Graph 40 Percent 30 20 10 0 A B C Class Percent within all data. 2.21 (a)-(b) The classes are presented in column 1. The frequency distribution of the classes is presented in column 2. Dividing each frequency by the total number of observations, which is 5, results in each class’s relative frequency. The relative frequency distribution is presented in column 3. Class Frequency Relative Frequency A 3 0.60 B 1 0.20 C 1 0.20 5 1.00 Copyright ยฉ 2020 Pearson Education, Inc. Section 2.2 (c) We multiply each of the relative frequencies by 360 degrees to obtain the portion of the pie represented by each class. The result using Minitab is Pie Chart Category A B C C 20.0% B 20.0% A 60.0% (d) We use the bar chart to show the relative frequency with which each class occurs. The result is Bar Graph 60 50 Percent 40 30 20 10 0 A B C Class Percent within all data. 2.22 (a)-(b) The classes are presented in column 1. The frequency distribution of the classes is presented in column 2. Dividing each frequency by the total number of observations, which is 10, results in each class’s relative frequency. The relative frequency distribution is presented in column 3. Class Frequency Relative Frequency A 4 0.40 B 1 0.10 C 1 0.10 D 4 0.40 10 1.00 Copyright ยฉ 2020 Pearson Education, Inc. 25 26 Chapter 2 (c) We multiply each of the relative frequencies by 360 degrees to obtain the portion of the pie represented by each class. The result using Minitab is Pie Chart Category A B C D D 40.0% A 40.0% C 10.0% B 10.0% (d) We use the bar chart to show the relative frequency with which each class occurs. The result is Bar Chart 40 Percent 30 20 10 0 A B C D Class Percent within all data. 2.23 (a)-(b) The classes are presented in column 1. The frequency distribution of the classes is presented in column 2. Dividing each frequency by the total number of observations, which is 10, results in each class’s relative frequency. The relative frequency distribution is presented in column 3. Relative Frequency Class Frequency A 4 0.40 B 3 0.30 C 1 0.10 D 2 0.20 10 1.00 Copyright ยฉ 2020 Pearson Education, Inc. Section 2.2 (c) We multiply each of the relative frequencies by 360 degrees to obtain the portion of the pie represented by each class. The result using Minitab is Pie Chart Category A B C D D 20.0% A 40.0% C 10.0% B 30.0% (d) We use the bar chart to show the relative frequency with which each class occurs. The result is Bar Chart 40 Percent 30 20 10 0 A B C D Class Percent within all data. 2.24 (a)-(b) The classes are presented in column 1. The frequency distribution of the classes is presented in column 2. Dividing each frequency by the total number of observations, which is 20, results in each class’s relative frequency. The relative frequency distribution is presented in column 3. Class Frequency Relative Frequency A 3 0.15 B 6 0.30 C 4 0.20 D 3 0.15 E 4 0.20 20 1.00 Copyright ยฉ 2020 Pearson Education, Inc. 27 28 Chapter 2 (c) We multiply each of the relative frequencies by 360 degrees to obtain the portion of the pie represented by each class. The result using Minitab is Pie Chart Category A B C D E A 15.0% E 20.0% D 15.0% B 30.0% C 20.0% (d) We use the bar chart to show the relative frequency with which each class occurs. The result is Bar Chart 30 25 Percent 20 15 10 5 0 A B C D E Class Percent within all data. 2.25 (a)-(b) The classes are presented in column 1. The frequency distribution of the classes is presented in column 2. Dividing each frequency by the total number of observations, which is 20, results in each class’s relative frequency. The relative frequency distribution is presented in column 3. Class Frequency Relative Frequency A 1 0.05 B 3 0.15 C 7 0.35 D 7 0.35 E 2 0.10 20 1.00 Copyright ยฉ 2020 Pearson Education, Inc. Section 2.2 (c) We multiply each of the relative frequencies by 360 degrees to obtain the portion of the pie represented by each class. The result using Minitab is Pie Chart Category A B C D E A 5.0% E 10.0% B 15.0% D 35.0% C 35.0% (d) We use the bar chart to show the relative frequency with which each class occurs. The result is Bar Chart 40 Percent 30 20 10 0 A B C D E Class Percent within all data. 2.26 (a)-(b) The classes are the networks and are presented in column 1. The frequency distribution of the networks is presented in column 2. Dividing each frequency by the total number of shows, which is 20, results in each class’s relative frequency. The relative frequency distribution is presented in column 3. Network Frequency Relative Frequency ABC 2 0.10 CBS 11 0.55 Fox 2 0.10 NBC 5 0.25 20 1.00 Copyright ยฉ 2020 Pearson Education, Inc. 29 30 Chapter 2 (c) We multiply each of the relative frequencies by 360 degrees to obtain the portion of the pie represented by each network. The result is Pie Chart of NETWORK Category ABC CBS FOX NBC ABC 10.0% NBC 25.0% FOX 10.0% CBS 55.0% (d) We use the bar chart to show the relative frequency with which each network occurs. The result is Bar Chart of NETWORK 60 50 Percent 40 30 20 10 0 ABC CBS FOX NBC NETWORK Percent within all data. 2.27 (a)-(b) The classes are the NCAA wrestling champions and are presented in column 1. The frequency distribution of the champions is presented in column 2. Dividing each frequency by the total number of champions, which is 25, results in each class’s relative frequency. The relative frequency distribution is presented in column 3. Champion Frequency Relative Frequency Iowa 12 0.48 Penn State 3 0.12 Minnesota 3 0.12 Oklahoma St. 7 0.28 25 1.00 Copyright ยฉ 2020 Pearson Education, Inc. Section 2.2 31 (b) We multiply each of the relative frequencies by 360 degrees to obtain the portion of the pie represented by each team. The result is Pie Chart of CHAMPION Category Iowa Minnesota Oklahoma St. Penn State Penn State 12.0% Iowa 48.0% Oklahoma St. 28.0% Minnesota 12.0% (c) We use the bar chart to show the relative frequency with which each TEAM occurs. The result is Bar Chart of CHAMPION 50 Percent 40 30 20 10 0 Iowa Minnesota Oklahoma St. Penn State CHAMPION Percent within all data. 2.28 (a)-(b) The classes are the colleges and are presented in column 1. The frequency distribution of the colleges is presented in column 2. Dividing each frequency by the total number of students in the section of Introduction to Computer Science, which is 25, results in each class’s relative frequency. The relative frequency distribution is presented in column 3. College Frequency Relative Frequency BUS 9 0.36 ENG 12 0.48 LIB 4 0.16 25 1.00 Copyright ยฉ 2020 Pearson Education, Inc. 32 Chapter 2 (c) We multiply each of the relative frequencies by 360 degrees to obtain the portion of the pie represented by each college. The result is COLLEGE Category ENG BUS LIB LIB 16.0% ENG 48.0% BUS 36.0% (b) We use the bar chart to show the relative frequency with which each COLLEGE occurs. The result is COLLEGE 50 Percent 40 30 20 10 0 BUS ENG COLLEGE LIB Percent within all data. 2.29 (a)-(b) The classes are the class levels and are presented in column 1. The frequency distribution of the class levels is presented in column 2. Dividing each frequency by the total number of students in the introductory statistics class, which is 40, results in each class’s relative frequency. The relative frequency distribution is presented in column 3. Class Level Frequency Relative Frequency Fr 6 0.150 So 15 0.375 Jr 12 0.300 Sr 7 0.175 40 1.000 Copyright ยฉ 2020 Pearson Education, Inc. Section 2.2 33 (c) We multiply each of the relative frequencies by 360 degrees to obtain the portion of the pie represented by each class level. The result is CLASS C ategory So Jr Sr Fr Fr 15.0% So 37.5% Sr 17.5% Jr 30.0% (d) We use the bar chart to show the relative frequency with which each CLASS level occurs. The result is CLASS 40 Percent 30 20 10 0 Fr So Jr Sr CLASS Percent within all data. 2.30 (a)-(b) The classes are the regions and are presented in column 1. The frequency distribution of the regions is presented in column 2. Dividing each frequency by the total number of states, which is 50, results in each class’s relative frequency. The relative frequency distribution is presented in column 3. Class Level Frequency Relative Frequency NE 9 0.18 MW 12 0.24 SO 16 0.32 WE 13 0.26 50 1.00 Copyright ยฉ 2020 Pearson Education, Inc. 34 Chapter 2 (c) We multiply each of the relative frequencies by 360 degrees to obtain the portion of the pie represented by each region. The result is REGION C ategory NE MW WE SO NE 18.0% SO 32.0% MW 24.0% WE 26.0% (d) We use the bar chart to show the relative frequency with which each REGION occurs. The result is REGION 35 30 Percent 25 20 15 10 5 0 NE MW WE SO REGION Percent within all data. 2.31 (a)-(b) The classes are the days and are presented in column 1. The frequency distribution of the days is presented in column 2. Dividing each frequency by the total number road rage incidents, which is 69, results in each class’s relative frequency. The relative frequency distribution is presented in column 3. Class Level Frequency Relative Frequency Su 5 0.0725 M 5 0.0725 Tu 11 0.1594 W 12 0.1739 Th 11 0.1594 F 18 0.2609 Sa 7 0.1014 69 1.0000 Copyright ยฉ 2020 Pearson Education, Inc. Section 2.2 (c) We multiply each of the relative frequencies by 360 degrees to obtain the portion of the pie represented by each day. The result is DAY C ategory F W Tu Th Sa Su M M 7.2% Su 7.2% F 26.1% Sa 10.1% Th 15.9% W 17.4% Tu 15.9% (d) We use the bar chart to show the relative frequency with which each DAY occurs. The result is DAY 25 Percent 20 15 10 5 0 Su M Tu W DAY Th F Sa Percent within all data. 2.32 (a) We find each of the relative frequencies by dividing each of the frequencies by the total frequency of 291,176. Due to rounding, the sum of the relative frequency column is 0.9999. Robbery Type Frequency Street/highway 127,403 Relative Frequency 0.4375 Commercial house 37,885 0.1301 Gas or service station 7,009 0.0241 Convenience store 14,863 0.0510 Residence 49,361 0.1695 Bank 5,777 0.0198 Miscellaneous 48,878 0.1679 291,176 0.9999 Copyright ยฉ 2020 Pearson Education, Inc. 35 36 Chapter 2 (b) We multiply each of the relative frequencies by 360 degrees to obtain the portion of the pie represented by each robbery type. The result is Pie Chart of ROBBERY TYPE Category Street/highway Commercial house Gas or service station Convenience store Residence Bank Miscellaneous Miscellaneous 16.8% Bank 2.0% Street/highway 43.8% Residence 17.0% Convenience store 5.1%station Gas or service 2.4% Commercial house 13.0% (c) We use the bar chart to show the relative frequency with which each robbery type occurs. The result is Bar Chart Percent of FREQUENCY 50 40 30 20 10 0 / et re St y wa gh hi Co m m c er lh ia se ou s Ga or e ic rv se n io at st C ce en ni ve on o st re e nc de si Re nk Ba s ou ne la el isc M ROBBERY TYPE Percent within all data. 2.33 (a) We find the relative frequencies by dividing each of the frequencies by the total sample size of 509. Color Frequency Brown 152 Relative Frequency 0.2986 Yellow 114 0.2240 Red 106 0.2083 Orange 51 0.1002 Green 43 0.0845 Blue 43 0.0845 509 1.0000 Copyright ยฉ 2020 Pearson Education, Inc. Section 2.2 37 (b) We multiply each of the relative frequencies by 360 degrees to obtain the portion of the pie represented by each color of M&M. The result is Pie Chart of RELATIVE FREQUENCY vs COLOR BLUE 0.0844794, 8.4% GREEN 0.0844794, 8.4% BRO WN 0.298625, 29.9% ORA NGE 0.100196, 10.0% RED 0.208251, 20.8% YELLO W 0.223969, 22.4% (c) We use the bar chart to show the relative frequency with which each color occurs. The result is Chart of RELATIVE FREQUENCY vs COLOR 0.30 RELATIVE FREQUENCY 0.25 0.20 0.15 0.10 0.05 0.00 2.34 BROWN YELLOW RED ORANGE COLOR GREEN BLUE (a) We find the relative frequencies by dividing each of the frequencies by the total sample size of 500. Political View Frequency Relative Frequency Liberal 147 0.294 Moderate 237 0.474 Conservative 116 0.232 500 1.000 Copyright ยฉ 2020 Pearson Education, Inc. 38 Chapter 2 (b) We multiply each of the relative frequencies by 360 degrees to obtain the portion of the pie represented by each political view. The result is Pie Chart of VIEW Conservative 23.2% Liberal 29.4% Category Liberal Moderate Conservative Moderate 47.4% (c) We use the bar chart to show the relative frequency with which each political view occurs. The result is Bar Chart Percent of FREQUENCY 50 40 30 20 10 0 Liberal Moderate Conservative POLITICAL VIEW Percent within all data. 2.35 (a) We find the relative frequencies by dividing each of the frequencies by the total sample size of 137,925. Rank Frequency Professor 32,511 Relative Frequency 0.2357 Associate professor 28,572 0.2072 Assistant professor 59,277 0.4298 Instructor 14,289 0.1036 Other 3,276 0.0238 137,925 1.0000 Copyright ยฉ 2020 Pearson Education, Inc. Section 2.2 39 (b) We multiply each of the relative frequencies by 360 degrees to obtain the portion of the pie represented by each rank. The result is Pie Chart of RANK Instructor 10.4% Category Professor Associate professor Assistant professor Instructor other other 2.4% Professor 23.6% Associate professor 20.7% Assistant professor 43.0% (c) We use the bar chart to show the relative frequency with which each rank occurs. The result is Bar Chart Percent of FREQUENCY 40 30 20 10 0 Professor Associate professor Assistant professor Instructor Other RANK Percent within all data. 2.36 (a) We find the relative frequencies by dividing each of the frequencies by the total sample size of 226. The sum of the relative frequency columns is 0.9999 due to rounding. Drug Sold Frequency Marijuana 73 Relative Frequency 0.3230 Crack cocaine 62 0.2743 Powder cocaine 45 0.1991 Ecstasy 20 0.0885 Methamphetamine 17 0.0752 Heroin 5 0.0221 Other 4 0.0177 226 0.9999 Copyright ยฉ 2020 Pearson Education, Inc. 40 Chapter 2 (b) We multiply each of the relative frequencies by 360 degrees to obtain the portion of the pie represented by each drug type. The result is Pie Chart of DRUG Methamphetamine 7.5% Category Marijuana Crack cocaine Powder cocaine Ecstasy Methamphetamine Heroin other other Heroin 2.2%1.8% Ecstasy 8.8% Marijuana 32.3% Powder cocaine 19.9% Crack cocaine 27.4% (c) We use the bar chart to show the relative frequency with which each rank occurs. The result is Bar Chart Percent of FREQUENCY 35 30 25 20 15 10 5 0 ij ar M na ua k ac Cr c co ne ai w Po oc rc de ne ai y as st Ec a et ph m ha t e M e in m H n oi er r he Ot DRUG Percent within all data. 2.37 (a) We first find the relative frequencies by dividing each of the frequencies by the total sample size of 200. Color Frequency Relative Frequency 0.44 Red 88 Black 102 0.51 Green 10 0.05 200 1.00 Copyright ยฉ 2020 Pearson Education, Inc. Section 2.2 41 (b) We multiply each of the relative frequencies by 360 degrees to obtain the portion of the pie represented by each color. The result is COLOR C ategory Black Red Green Green 5.0% Black 51.0% Red 44.0% (c) We use the bar chart to show the relative frequency with which each color occurs. The result is COLOR Percent of FREQUENCY 50 40 30 20 10 0 Red Black NUMBER Green Percent within all data. 2.38 (a) The classes are the different levels of health status and are presented in column 1. The frequency distribution of health status is presented in column 2. Dividing each frequency by the total number of people, which is 188.3 million for persons aged 19-64 and 41.5 million for persons aged 65 and over, results in each class’s relative frequency. The relative frequency distribution is presented in column 3. For People aged 19-64 Health Status Frequency Excellent or very good 119.7 Relative Frequency 0.636 Good 48.4 0.257 Fair or poor 20.2 0.107 188.3 1.000 Copyright ยฉ 2020 Pearson Education, Inc. 42 Chapter 2 For People aged 65 and over Health Status Frequency Excellent or very good 18.1 Relative Frequency 0.436 Good 14.2 0.342 Fair or poor 9.2 0.222 41.5 1.000 (b) We multiply each of the relative frequencies by 360 degrees to obtain the portion of each pie represented by each health status. The results are Pie Chart of HEALTH STATUS 1 9-64 65+ Fair or poor 10.7% Category Excellent /very good Good Fair or poor Fair or poor 22.2% Excellent /very good 43.6% Good 25.7% Excellent /very good 63.6% Good 34.2% 2.39 (c) A bigger proportion of persons aged 19-64 have a health status of excellent or very good than persons aged 65 and over. A smaller proportion of persons aged 19-64 have a health status of fair or poor than persons aged 65 and over. (a) Using Minitab, retrieve the data from the WeissStats Resource Site. Column 1 contains the type of the vehicle. From the tool bar, select ๏€ผ ๏€ผ Stat Tables Tally Individual Variables, double-click on TYPE in the first box so that TYPE appears in the Variables box, put a check mark next to Counts and Percents under Display, and click OK. The result is TYPE Bus Car Truck N= Count 21 667 62 750 Percent 2.80 88.93 8.27 (b) The relative frequencies were calculated in part(a) by putting a check mark next to Percents. 2.8% of the vehicles were busses, 88.93% of the vehicles were cars, and 8.27% of the vehicles were trucks. ๏€ผ (c) Using Minitab, select Graph Pie Chart, check Chart counts of unique values, double-click on TYPE in the first box so that TYPE appears in the Categorical Variables box. Click Pie Options, check decreasing volume, click OK. Click Labels, enter TYPE in for the title, click Slice Labels, check Category Name, Percent, and Draw a line from label to slice, Click OK twice. The result is Copyright ยฉ 2020 Pearson Education, Inc. Section 2.2 43 Pie Chart of TYPE Truck 8.3% Category Car Truck Bus Bus 2.8% Car 88.9% ๏€ผ (d) Using Minitab, select Graph Bar Chart, select Counts of unique values, select Simple option, click OK. Double-click on TYPE in the first box so that TYPE appears in the Categorical Variables box. Select Chart Options, check decreasing Y, check show Y as a percent, click OK. Select Labels, enter in TYPE as the title. Click OK twice. The result is TYPE 90 80 70 Percent 60 50 40 30 20 10 0 Car Truck Bus TYPE Percent within all data. 2.40 (a) Using Minitab, retrieve the data from the WeissStats Resource Site. Column 2 contains the marital status and column 3 contains the number ๏€ผ ๏€ผ Tables Tally of drinks per month. From the tool bar, select Stat Individual Variables, double-click on STATUS and DRINKS in the first box so that both STATUS and DRINKS appear in the Variables box, put a check mark next to Counts and Percents under Display, and click OK. The results are STATUS Count Single 354 Married 1173 Widowed 143 Divorced 102 N= 1772 Percent 19.98 66.20 8.07 5.76 DRINKS Count Percent Abstain 590 33.30 1-60 957 54.01 Over 60 225 12.70 N= 1772 (b) The relative frequencies were calculated in part(a) by putting a check mark next to Percents. For the STATUS variable; 19.98% of the US Adults are single, 66.20% are married, 8.07% are widowed, and 5.76% are divorced. For the DRINKS variable, 33.30% of US Adults abstain from drinking, 54.01% have 1-60 drinks per month, and 12.70% have over 60 drinks per month. Copyright ยฉ 2020 Pearson Education, Inc. 44 Chapter 2 ๏€ผ (c) Using Minitab, select Graph Pie Chart, check Chart counts of unique values, double-click on STATUS and DRINKS in the first box so that STATUS and DRINKS appear in the Categorical Variables box. Click Pie Options, check decreasing volume, click OK. Click Multiple Graphs, check On the Same Graphs, Click OK. Click Labels, click Slice Labels, check Category Name, Percent, and Draw a line from label to slice, Click OK twice. The results are STATUS and DRINKS STATUS DRINKS Div orced Widowed 5.8% 8.1% Category Married Single Widowed Div orced A bstain 1-60 Ov er 60 Ov er 60 12.7% Single 20.0% 1-60 54.0% A bstain 33.3% Married 66.2% ๏€ผ (d) Using Minitab, select Graph Bar Chart, select Counts of unique values, select Simple option, click OK. Double-click on STATUS and DRINKS in the first box so that STATUS and DRINKS appear in the Categorical Variables box. Select Chart Options, check decreasing Y, check show Y as a percent, click OK. Click OK twice. The results are Chart of DRINKS Chart of STATUS 70 60 60 50 40 Percent Percent 50 40 30 20 20 10 10 0 30 Married Single Widowed Divorced 0 1-60 Abstain DRINKS STATUS Percent within all data. Percent within all data. 2.41 Over 60 (a) Using Minitab, retrieve the data from the WeissStats Resource Site. Column 2 contains the preference for how the members want to receive the ballots and column 3 contains the highest degree obtained by the ๏€ผ ๏€ผ members. From the tool bar, select Stat Tables Tally Individual Variables, double-click on PREFERENCE and DEGREE in the first box so that both PREFERENCE and DEGREE appear in the Variables box, put a check mark next to Counts and Percents under Display, and click OK. The results are PREFERENCE Both Email Mail N/A N= Count 112 239 86 129 566 Percent 19.79 42.23 15.19 22.79 DEGREE MA Other PhD N= Count 167 11 388 566 Percent 29.51 1.94 68.55 Copyright ยฉ 2020 Pearson Education, Inc. Section 2.2 45 (b) The relative frequencies were calculated in part(a) by putting a check mark next to Percents. For the PREFERENCE variable; 19.79% of the members prefer to receive the ballot by both e-mail and mail, 42.23% prefer e-mail, 15.19% prefer mail, and 22.79% didnโ€™t list a preference. For the Degree variable; 29.51% obtained a Masterโ€™s degree, 68.55% obtained a PhD, and 1.94% received a different degree. ๏€ผ (c) Using Minitab, select Graph Pie Chart, check Chart counts of unique values, double-click on PREFERENCE and DEGREE in the first box so that PREFERENCE and DEGREE appear in the Categorical Variables box. Click Pie Options, check decreasing volume, click OK. Click Multiple Graphs, check On the Same Graphs, Click OK. Click Labels, click Slice Labels, check Category Name, Percent, and Draw a line from label to slice, Click OK twice. The results are Pie Chart of PREFERENCE, DEGREE PREFERENCE DEGREE Category Email N/A Both Mail MA other PhD other 1.9% Mail 15.2% MA 29.5% Email 42.2% Both 19.8% PhD 68.6% N/A 22.8% ๏€ผ (d) Using Minitab, select Graph Bar Chart, select Counts of unique values, select Simple option, click OK. Double-click on PREFERENCE and DEGREE in the first box so that PREFERENCE and DEGREE appear in the Categorical Variables box. Select Chart Options, check decreasing Y, check show Y as a percent, click OK. Click OK twice. The results are Chart of DEGREE Chart of PREFERENCE 70 40 60 50 Percent Percent 30 20 40 30 20 10 10 0 Email N/A Both Mail 0 PhD PREFERENCE Percent within all data. Percent within all data. Copyright ยฉ 2020 Pearson Education, Inc. MA DEGREE Other 46 Chapter 2 Exercises 2.3 2.42 One important reason for grouping data is that grouping often makes a large and complicated set of data more compact and easier to understand. 2.43 For class limits, marks, cutpoints and midpoints to make sense, data must be numerical. They do not make sense for qualitative data classes because such data are nonnumerical. 2.44 The most important guidelines in choosing the classes for grouping a data set are: (1) the number of classes should be small enough to provide an effective summary, but large enough to display the relevant characteristics of the data; (2) each observation must belong to one, and only one, class; and (3) whenever feasible, all classes should have the same width. 2.45 In the first method for depicting classes called cutpoint grouping, we used the notation a โ€“ under b to mean values that are greater than or equal to a and up to, but not including b, such as 30 โ€“ under 40 to mean a range of values greater than or equal to 30, but strictly less than 40. In the alternate method called limit grouping, we used the notation a-b to indicate a class that extends from a to b, including both. For example, 3039 is a class that includes both 30 and 39. The alternate method is especially appropriate when all of the data values are integers. If the data include values like 39.7 or 39.93, the first method is more advantageous since the cutpoints remain integers; whereas, in the alternate method, the upper limits for each class would have to be expressed in decimal form such as 39.9 or 39.99. 2.46 (a) For continuous data displayed to one or more decimal places, using the cutpoint grouping is best since the description of the classes is simpler, regardless of the number of decimal places displayed. (b) For discrete data with relatively few distinct observations, the single value grouping is best since either of the other two methods would result in combining some of those distinct values into single classes, resulting in too few classes, possibly less than 5. 2.47 For limit grouping, we find the class mark, which is the average of the lower and upper class limit. For cutpoint grouping, we find the class midpoint, which is the average of the two cutpoints. 2.48 A frequency histogram shows the actual frequencies on the vertical axis; whereas, the relative frequency histogram always shows proportions (between 0 and 1) or percentages (between 0 and 100) on the vertical axis. 2.49 An advantage of the frequency histogram over a frequency distribution is that it is possible to get an overall view of the data more easily. A disadvantage of the frequency histogram is that it may not be possible to determine exact frequencies for the classes when the number of observations is large. 2.50 By showing the lower class limits (or cutpoints) on the horizontal axis, the range of possible data values in each class is immediately known and the class mark (or midpoint) can be quickly determined. This is particularly helpful if it is not convenient to make all classes the same width. The use of the class mark (or midpoint) is appropriate when each class consists of a single value (which is, of course, also the midpoint). Use of the class marks (or midpoints) is not appropriate in other situations since it may be difficult to determine the location of the class limits (or cutpoints) from the values of the class marks (or midpoints), particularly if the class marks (or midpoints) are not evenly spaced. Class Marks (or midpoints) cannot be used if there is an open class. Copyright ยฉ 2020 Pearson Education, Inc. Section 2.3 47 2.51 If the classes consist of single values, stem-and-leaf diagrams and frequency histograms are equally useful. If only one diagram is needed and the classes consist of more than one value, the stem-and-leaf diagram allows one to retrieve all of the original data values whereas the frequency histogram does not. If two or more sets of data of different sizes are to be compared, the relative frequency histogram is advantageous because all of the diagrams to be compared will have the same total relative frequency of 1.00. Finally, stem-and-leaf diagrams are not very useful with very large data sets and may present problems with data having many digits in each number. 2.52 The histogram (especially one using relative frequencies) is generally preferable. Data sets with a large number of observations may result in a stem of the stem-and-leaf diagram having more leaves than will fit on the line. In that case, the histogram would be preferable. 2.53 You can reconstruct the stem-and-leaf diagram using two lines per stem. For example, instead of listing all of the values from 10 to 19 on a โ€˜1โ€™ stem, you can make two โ€˜1โ€™ stems. On the first, you record the values from 10 to 14 and on the second, the values from 15 to 19. If there are still two few stems, you can reconstruct the diagram using five lines per stem, recording 10 and 11 on the first line, 12 and 13 on the second, and so on. 2.54 For the number of bedrooms per single-family dwelling, single-value grouping is probably the best because the data is discrete with relatively few distinct observations. 2.55 For the ages of householders, given as a whole number, limit grouping is probably the best because the data are given as whole numbers and there are probably too many distinct observations to list them as single-value grouping. 2.56 For additional sleep obtained by a sample of 100 patients by using a particular brand of sleeping pill, cutpoint grouping is probably the best because the data is continuous and the data was recorded to the nearest tenth of an hour. 2.57 For the number of automobiles per family, single-value grouping is probably the best because the data is discrete with relatively few distinct observations. 2.58 For gas mileages, rounded to the nearest number of miles per gallon, limit grouping is probably the best because the data are given as whole numbers and there are probably too many distinct observations to list them as single-value grouping. 2.59 For carapace length for a sample of giant tarantulas, cutpoint grouping is probably the best because the data is continuous and the data was recorded to the nearest hundredth of a millimeter. 2.60 (a) Since the data values range from 1 to 4, we construct a table with classes based on a single value. The resulting table follows. Single Value Class 1 2 3 4 Frequency 2 0 5 3 10 Copyright ยฉ 2020 Pearson Education, Inc. 48 Chapter 2 (b) To get the relative frequencies, divide each frequency by the sample size of 10. Single Value Class 1 2 3 4 (c) Relative Frequency 0.20 0.00 0.50 0.30 1.00 The frequency histogram in Figure (a) is constructed using the frequency distribution presented in part (a) of this exercise. Column 1 demonstrates that the data are grouped using classes based on a single value. These single values in column 1 are used to label the horizontal axis of the frequency histogram. When classes are based on a single value, the middle of each histogram bar is placed directly over the single numerical value represented by the class. Also, the height of each bar in the frequency histogram matches the respective frequency in column 2. Figure (b) 5 50 4 40 3 30 Percent Frequency Figure (a) 2 20 1 10 0 1 2 3 0 4 1 2 3 4 DATA DATA (d) The relative-frequency histogram in Figure (b) is constructed using the relative-frequency distribution presented in part (b) of this exercise. It has the same horizontal axis as the frequency histogram. The middle of each histogram bar is placed directly over the single numerical value represented by the class. Also, the height of each bar in the relative-frequency histogram matches the respective relative frequency in column 2. 2.61 (a) Since the data values range from 1 to 4, we construct a table with classes based on a single value. The resulting table follows. Single Value Class 1 2 3 4 Frequency 2 2 5 1 10 Copyright ยฉ 2020 Pearson Education, Inc. Section 2.3 49 (b) To get the relative frequencies, divide each frequency by the sample size of 10. Single Value Class 1 2 3 4 (c) Relative Frequency 0.20 0.20 0.50 0.10 1.00 The frequency histogram in Figure (a) is constructed using the frequency distribution presented in part (a) of this exercise. Column 1 demonstrates that the data are grouped using classes based on a single value. These single values in column 1 are used to label the horizontal axis of the frequency histogram. When classes are based on a single value, the middle of each histogram bar is placed directly over the single numerical value represented by the class. Also, the height of each bar in the frequency histogram matches the respective frequency in column 2. Figure (a) Figure (b) 50 5 40 Percent Frequency 4 3 30 2 20 1 10 0 1 2 3 0 4 1 2 3 4 DATA DATA (d) The relative-frequency histogram in Figure (b) is constructed using the relative-frequency distribution presented in part (b) of this exercise. It has the same horizontal axis as the frequency histogram. The middle of each histogram bar is placed directly over the single numerical value represented by the class. Also, the height of each bar in the relative-frequency histogram matches the respective relative frequency in column 2. 2.62 (a) Since the data values range from 0 to 4, we construct a table with classes based on a single value. The resulting table follows. Single Value Class 0 1 2 3 4 Frequency 2 8 7 2 1 20 Copyright ยฉ 2020 Pearson Education, Inc. 50 Chapter 2 (b) To get the relative frequencies, divide each frequency by the sample size of 20. Single Value Class 0 1 2 3 4 (c) Relative Frequency 0.10 0.40 0.35 0.10 0.05 1.00 The frequency histogram in Figure (a) is constructed using the frequency distribution presented in part (a) of this exercise. Column 1 demonstrates that the data are grouped using classes based on a single value. These single values in column 1 are used to label the horizontal axis of the frequency histogram. When classes are based on a single value, the middle of each histogram bar is placed directly over the single numerical value represented by the class. Also, the height of each bar in the frequency histogram matches the respective frequency in column 2. Figure (a) Figure (b) 9 40 8 7 30 Percent Frequency 6 5 4 20 3 10 2 1 0 0 1 2 3 0 4 0 1 DATA 2 3 4 DATA (d) The relative-frequency histogram in Figure (b) is constructed using the relative-frequency distribution presented in part (b) of this exercise. It has the same horizontal axis as the frequency histogram. The middle of each histogram bar is placed directly over the single numerical value represented by the class. Also, the height of each bar in the relative-frequency histogram matches the respective relative frequency in column 2. 2.63 (a) Since the data values range from 0 to 4, we construct a table with classes based on a single value. The resulting table follows. Single Value Class 0 1 2 3 4 Frequency 1 1 4 8 6 20 Copyright ยฉ 2020 Pearson Education, Inc. Section 2.3 51 (b) To get the relative frequencies, divide each frequency by the sample size of 20. Single Value Class 0 1 2 3 4 (c) Relative Frequency 0.05 0.05 0.20 0.40 0.30 1.00 The frequency histogram in Figure (a) is constructed using the frequency distribution presented in part (a) of this exercise. Column 1 demonstrates that the data are grouped using classes based on a single value. These single values in column 1 are used to label the horizontal axis of the frequency histogram. When classes are based on a single value, the middle of each histogram bar is placed directly over the single numerical value represented by the class. Also, the height of each bar in the frequency histogram matches the respective frequency in column 2. Figure (a) Figure (b) 9 40 8 7 30 5 Percent Frequency 6 4 20 3 10 2 1 0 0 1 2 3 4 0 0 DATA 1 2 3 4 DATA (d) The relative-frequency histogram in Figure (b) is constructed using the relative-frequency distribution presented in part (b) of this exercise. It has the same horizontal axis as the frequency histogram. The middle of each histogram bar is placed directly over the single numerical value represented by the class. Also, the height of each bar in the relative-frequency histogram matches the respective relative frequency in column 2. 2.64 (a) The first class to construct is 0-9. The width of all the classes is 10, so the next class would be 10-19. The classes are presented in column 1. The last class to construct is 40-49, since the largest single data value is 41. The tallied results are presented in column 2, which lists the frequencies. Limit Grouping Classes 0-9 10-19 20-29 30-39 40-49 Frequency 3 3 5 8 1 20 Copyright ยฉ 2020 Pearson Education, Inc. 52 Chapter 2 (b) Dividing each frequency by the total number of observations, which is 20, results in each class’s relative frequency. The relative frequencies for all classes are presented in column 2. The resulting table follows. Limit Grouping Classes 0-9 10-19 20-29 30-39 40-49 Relative Frequency 0.15 0.15 0.25 0.40 0.05 1.00 (c) The frequency histogram in Figure (a) is constructed using the frequency distribution presented in part (a) of this exercise. The lower class limits of column 1 are used to label the horizontal axis of the frequency histogram. The height of each bar in the frequency histogram matches the respective frequency in column 2. (d) The relative-frequency histogram in Figure (b) is constructed using the relative-frequency distribution presented in part (b) of this exercise. It has the same horizontal axis as the frequency histogram. The height of each bar in the relative-frequency histogram matches the respective relative frequency in column 2. Figure (a) Figure (b) 9 40 8 7 30 Percent Frequency 6 5 4 20 3 10 2 1 0 0 10 20 30 40 50 0 0 10 DATA 2.65 20 30 40 50 DATA (a) The first class to construct is 0-4. The width of all the classes is 5, so the next class would be 5-9. The classes are presented in column 1. The last class to construct is 25-29, since the largest single data value is 26. The tallied results are presented in column 2, which lists the frequencies. Limit Grouping Classes 0-4 5-9 10-14 15-19 20-24 25-29 (b) Frequency 5 5 1 4 2 3 20 Dividing each frequency by the total number of observations, which is 20, results in each class’s relative frequency. The relative frequencies for all classes are presented in column 2. The resulting table follows. Copyright ยฉ 2020 Pearson Education, Inc. Section 2.3 Limit Grouping Classes 0-4 5-9 10-14 15-19 20-24 25-29 Relative Frequency 0.25 0.25 0.05 0.20 0.10 0.15 1.00 (c) The frequency histogram in Figure (a) is constructed using the frequency distribution presented in part (a) of this exercise. The lower class limits of column 1 are used to label the horizontal axis of the frequency histogram. The height of each bar in the frequency histogram matches the respective frequency in column 2. (d) The relative-frequency histogram in Figure (b) is constructed using the relative-frequency distribution presented in part (b) of this exercise. It has the same horizontal axis as the frequency histogram. The height of each bar in the relative-frequency histogram matches the respective relative frequency in column 2. Figure (b) 5 25 4 20 3 15 Percent Frequency Figure (a) 2 10 1 5 0 0 5 10 15 20 25 30 0 0 5 DATA 2.66 53 10 15 20 25 30 DATA (a) The first class to construct is 30-36. The width of all the classes is 7, so the next class would be 37-43. The classes are presented in column 1. The last class to construct is 72-78, since the largest single data value is 78. The tallied results are presented in column 2, which lists the frequencies. Limit Grouping Classes 30-36 37-43 44-50 51-57 58-64 65-71 72-78 (b) Frequency 7 2 5 4 3 2 2 25 Dividing each frequency by the total number of observations, which is 25, results in each class’s relative frequency. The relative frequencies for all classes are presented in column 2. The resulting table follows. Copyright ยฉ 2020 Pearson Education, Inc. 54 Chapter 2 Limit Grouping Classes 30-36 37-43 44-50 51-57 58-64 65-71 72-78 Relative Frequency 0.28 0.08 0.20 0.16 0.12 0.08 0.08 1.00 (c) The frequency histogram in Figure (a) is constructed using the frequency distribution presented in part (a) of this exercise. The lower class limits of column 1 are used to label the horizontal axis of the frequency histogram. The height of each bar in the frequency histogram matches the respective frequency in column 2. (d) The relative-frequency histogram in Figure (b) is constructed using the relative-frequency distribution presented in part (b) of this exercise. It has the same horizontal axis as the frequency histogram. The height of each bar in the relative-frequency histogram matches the respective relative frequency in column 2. Figure (a) Figure (b) 30 7 25 6 20 Percent Frequency 5 4 3 15 10 2 5 1 0 30 37 44 51 58 65 72 78 0 30 37 44 DATA 2.67 51 58 65 72 78 DATA (a) The first class to construct is 50-59. The width of all the classes is 10, so the next class would be 60-69. The classes are presented in column 1. The last class to construct is 90-99, since the largest single data value is 98. The tallied results are presented in column 2, which lists the frequencies. Limit Grouping Classes 50-59 60-69 70-79 80-89 90-99 (b) Frequency 6 3 6 7 3 25 Dividing each frequency by the total number of observations, which is 25, results in each class’s relative frequency. The relative frequencies for all classes are presented in column 2. The resulting table follows. Copyright ยฉ 2020 Pearson Education, Inc. Section 2.3 Limit Grouping Classes 50-59 60-69 70-79 80-89 90-99 55 Relative Frequency 0.24 0.12 0.24 0.28 0.12 1.00 (c) The frequency histogram in Figure (a) is constructed using the frequency distribution presented in part (a) of this exercise. The lower class limits of column 1 are used to label the horizontal axis of the frequency histogram. The height of each bar in the frequency histogram matches the respective frequency in column 2. (d) The relative-frequency histogram in Figure (b) is constructed using the relative-frequency distribution presented in part (b) of this exercise. It has the same horizontal axis as the frequency histogram. The height of each bar in the relative-frequency histogram matches the respective relative frequency in column 2. Figure (a) Figure (b) 30 7 25 6 20 Percent Frequency 5 4 3 15 10 2 5 1 0 50 60 70 80 90 1 00 0 50 60 DATA 2.68 70 80 90 1 00 DATA (a) The first class to construct is 10 โ€“ under 15. Since all classes are to be of equal width 5, the second class is 15 โ€“ under 20. All of the classes are presented in column 1. The last class to construct is 35 โ€“ under 40, since the largest single data value is 38.8. The results of the tallying are presented in column 2, which lists the frequencies. Cutpoint Grouping Classes 10 โ€“ under 15 15 โ€“ under 20 20 โ€“ under 25 25 โ€“ under 30 30 โ€“ under 35 35 โ€“ under 40 Frequency 4 5 7 3 0 1 20 (b) Dividing each frequency by the total number of observations, which is 20, results in each class’s relative frequency. The relative frequencies for all classes are presented in column 2. Copyright ยฉ 2020 Pearson Education, Inc. 56 Chapter 2 Cutpoint Grouping Classes 10 โ€“ under 15 15 โ€“ under 20 20 โ€“ under 25 25 โ€“ under 30 30 โ€“ under 35 35 โ€“ under 40 Relative Frequency 0.20 0.25 0.35 0.15 0.00 0.05 1.00 (c) The frequency histogram in Figure (a) is constructed using the frequency distribution obtained in part (a) of this exercise. The cutpoints are used to label the horizontal axis. Also, the height of each bar in the frequency histogram matches the respective frequency in column 2. (d) The relative-frequency histogram in Figure (b) is constructed using the relative-frequency distribution obtained in part (b) of this exercise. It has the same horizontal axis as the frequency histogram. The height of each bar in the relative-frequency histogram matches the respective relative frequency in column 2. Figure (a) Figure (b) 40 7 6 30 Percent Frequency 5 4 20 3 2 10 1 0 10 15 20 25 30 35 40 0 10 15 20 2.69 25 30 35 40 DATA DATA (a) The first class to construct is 40 โ€“ under 46. Since all classes are to be of equal width 6, the second class is 46 โ€“ under 52. All of the classes are presented in column 1. The last class to construct is 64 โ€“ under 70, since the largest single data value is 65.4. The results of the tallying are presented in column 2, which lists the frequencies. Cutpoint Grouping Classes 40 โ€“ under 46 46 โ€“ under 52 52 โ€“ under 58 58 โ€“ under 64 64 โ€“ under 70 Frequency 3 6 10 0 1 20 (b) Dividing each frequency by the total number of observations, which is 20, results in each class’s relative frequency. The relative frequencies for all classes are presented in column 2. Copyright ยฉ 2020 Pearson Education, Inc. Section 2.3 57 Cutpoint Grouping 40 โ€“ under 46 46 โ€“ under 52 52 โ€“ under 58 58 โ€“ under 64 64 โ€“ under 70 Relative Frequency 0.15 0.30 0.50 0.00 0.05 1.00 (c) The frequency histogram in Figure (a) is constructed using the frequency distribution obtained in part (a) of this exercise. The cutpoints are used to label the horizontal axis. Also, the height of each bar in the frequency histogram matches the respective frequency in column 2. (d) The relative-frequency histogram in Figure (b) is constructed using the relative-frequency distribution obtained in part (b) of this exercise. It has the same horizontal axis as the frequency histogram. The height of each bar in the relative-frequency histogram matches the respective relative frequency in column 2. Figure (a) Figure (b) 10 50 40 6 Percent Frequency 8 30 4 20 2 10 0 40 46 52 58 64 70 0 40 46 DATA 2.70 52 58 64 70 DATA (a) The first classโ€™ midpoint is 0.5 with a width of 1. Therefore, the first class to construct is 0 โ€“ under 1. Since all classes are to be of equal width 1, the second class is 1 โ€“ under 2. All of the classes are presented in column 1. The last class to construct is 7 โ€“ under 8, since the largest single data value is 7.69. The results of the tallying are presented in column 2, which lists the frequencies. Cutpoint Grouping Classes 0 โ€“ under 1 1 โ€“ under 2 2 โ€“ under 3 3 โ€“ under 4 4 โ€“ under 5 5 โ€“ under 6 6 โ€“ under 7 7 โ€“ under 8 Frequency 3 11 4 1 2 1 2 1 25 (b) Dividing each frequency by the total number of observations, which is 25, results in each class’s relative frequency. The relative frequencies for all classes are presented in column 2. Copyright ยฉ 2020 Pearson Education, Inc. 58 Chapter 2 Cutpoint Grouping Classes 0 โ€“ under 1 1 โ€“ under 2 2 โ€“ under 3 3 โ€“ under 4 4 โ€“ under 5 5 โ€“ under 6 6 โ€“ under 7 7 โ€“ under 8 Relative Frequency 0.12 0.44 0.16 0.04 0.08 0.04 0.08 0.04 1.00 (c) The frequency histogram in Figure (a) is constructed using the frequency distribution obtained in part (a) of this exercise. The cutpoints are used to label the horizontal axis. Also, the height of each bar in the frequency histogram matches the respective frequency in column 2. (d) The relative-frequency histogram in Figure (b) is constructed using the relative-frequency distribution obtained in part (b) of this exercise. It has the same horizontal axis as the frequency histogram. The height of each bar in the relative-frequency histogram matches the respective relative frequency in column 2. Figure (a) Figure (b) 12 50 10 40 Percent Frequency 8 6 30 20 4 10 2 0 0 2 4 6 8 0 0 2 DATA 2.71 4 6 8 DATA (a) The first classโ€™ cutpoint is 25 with a width of 3. Therefore, the first class to construct is 25 โ€“ under 28. Since all classes are to be of equal width 3, the second class is 28 โ€“ under 31. All of the classes are presented in column 1. The last class to construct is 43 โ€“ under 46, since the largest single data value is 43.01. The results of the tallying are presented in column 2, which lists the frequencies. Cutpoint Grouping Classes 25 โ€“ under 28 28 โ€“ under 31 31 โ€“ under 34 34 โ€“ under 37 37 โ€“ under 40 40 โ€“ under 43 43 โ€“ under 46 Frequency 1 2 5 7 5 4 1 25 (b) Dividing each frequency by the total number of observations, which is 25, results in each class’s relative frequency. The relative frequencies for all classes are presented in column 2. Copyright ยฉ 2020 Pearson Education, Inc. Section 2.3 59 Cutpoint Grouping Classes 25 โ€“ under 28 28 โ€“ under 31 31 โ€“ under 34 34 โ€“ under 37 37 โ€“ under 40 40 โ€“ under 43 43 โ€“ under 46 Relative Frequency 0.04 0.08 0.20 0.28 0.20 0.16 0.04 1.00 (c) The frequency histogram in Figure (a) is constructed using the frequency distribution obtained in part (a) of this exercise. The cutpoints are used to label the horizontal axis. Also, the height of each bar in the frequency histogram matches the respective frequency in column 2. (d) The relative-frequency histogram in Figure (b) is constructed using the relative-frequency distribution obtained in part (b) of this exercise. It has the same horizontal axis as the frequency histogram. The height of each bar in the relative-frequency histogram matches the respective relative frequency in column 2. Figure (a) Figure (b) 30 7 6 25 20 4 Percent Frequency 5 3 15 10 2 5 1 0 25 28 31 34 37 40 43 0 46 25 28 31 DATA 2.72 34 37 40 43 46 DATA The horizontal axis of this dotplot displays a range of possible values. To complete the dotplot, we go through the data set and record data value by placing a dot over the appropriate value on the horizontal axis. Dotplot of DATA 1 2 3 4 DATA Copyright ยฉ 2020 Pearson Education, Inc. 60 Chapter 2 2.73 The horizontal axis of this dotplot displays a range of possible values. To complete the dotplot, we go through the data set and record data value by placing a dot over the appropriate value on the horizontal axis. Dotplot of DATA 0 1 2 3 DATA 2.74 The horizontal axis of this dotplot displays a range of possible values. To complete the dotplot, we go through the data set and record data value by placing a dot over the appropriate value on the horizontal axis. Dotplot of DATA 10 11 12 13 14 15 DATA 2.75 The horizontal axis of this dotplot displays a range of possible values. To complete the dotplot, we go through the data set and record data value by placing a dot over the appropriate value on the horizontal axis. Dotplot of DATA 30 31 32 33 34 35 36 37 38 DATA Copyright ยฉ 2020 Pearson Education, Inc. Section 2.3 2.76 61 Each data value consists of 2 or 3 digit numbers ranging from 60 to 125. The last digit becomes the leaf and the remaining digits are the stems, so we have stems of 6 to 12. The resulting stem-and-leaf diagram is 6| 0 7| 8| 9| 79 10| 068 11| 278 12| 5 2.77 2.78 2.79 2.80 Each data value consists of 2 digit numbers ranging from 20 to 62. The last digit becomes the leaf and the remaining digits are the stems, so we have stems of 2 to 6. The resulting stem-and-leaf diagram is 2| 01 3| 2278 4| 13 5| 5 6| 2 Each data value consists of 1 or 2 digit numbers ranging from 5 to 23. The last digit becomes the leaf and the remaining digits are the stems, so we have stems of 0 to 2. Splitting the stems into five lines per stem, the resulting stem-and-leaf diagram is 0| 5 0| 0| 89 1| 001 1| 2 1| 44455 1| 667 1| 2| 0 2| 2233 Each data value consists of 2 digit numbers ranging from 22 to 46. The last digit becomes the leaf and the remaining digits are the stems, so we have stems of 2 to 4. Splitting the stems into two lines per stem, the resulting stem-and-leaf diagram is 2| 224 2| 5577789 3| 12234 3| 67 4| 0 4| 56 (a) Since the data values range from 0 to 4, we construct a table with classes based on a single value. The resulting table follows. Number of Siblings 0 1 2 3 4 Frequency 8 17 11 3 1 40 Copyright ยฉ 2020 Pearson Education, Inc. Chapter 2 (b) To get the relative frequencies, divide each frequency by the sample size of 40. Relative Frequency 0.200 0.425 0.275 0.075 0.025 1.000 (c) The frequency histogram in Figure (a) is constructed using the frequency distribution presented in part (a) of this exercise. Column 1 demonstrates that the data are grouped using classes based on a single value. These single values in column 1 are used to label the horizontal axis of the frequency histogram. Suitable candidates for vertical axis units in the frequency histogram are the integers within the range 0 through 17, since these are representative of the magnitude and spread of the frequencies presented in column 2. When classes are based on a single value, the middle of each histogram bar is placed directly over the single numerical value represented by the class. Also, the height of each bar in the frequency histogram matches the respective frequency in column 2. Number of Siblings 0 1 2 3 4 Figure (a) Histogram of SIBLINGS Histogram of SIBLINGS 18 40 16 14 30 Percent 12 Frequency 62 10 8 20 6 10 4 2 0 0 1 2 SIBLINGS 3 0 4 0 1 2 SIBLINGS 3 4 Figure (b) (d) The relative-frequency histogram in Figure (b) is constructed using the relative-frequency distribution presented in part (b) of this exercise. It has the same horizontal axis as the frequency histogram. We notice that the relative frequencies presented in column 2 range in size from 0.025 to 0.425. Thus, suitable candidates for vertical-axis units in the relative-frequency histogram are increments of 0.05 (or 5%), from zero to 0.45 (or 45%). The middle of each histogram bar is placed directly over the single numerical value represented by the class. Also, the height of each bar in the relative-frequency histogram matches the respective relative frequency in column 2. Copyright ยฉ 2020 Pearson Education, Inc. Section 2.3 2.81 63 (a) Since the data values range from 1 to 7, we construct a table with classes based on a single value. The resulting table follows. Number of Persons Frequency 1 7 2 13 3 9 4 5 5 4 6 1 7 1 40 (b) To get the relative frequencies, divide each frequency by the sample size of 40. Number of Persons Relative Frequency 1 0.175 2 0.325 3 0.225 4 0.125 5 0.100 6 0.025 7 0.025 1.000 (c) The frequency histogram in Figure (a) is constructed using the frequency distribution presented in part (a) of this exercise. Column 1 demonstrates that the data are grouped using classes based on a single value. These single values in column 1 are used to label the horizontal axis of the frequency histogram. Suitable candidates for vertical axis units in the frequency histogram are the integers within the range 0 through 13, since these are representative of the magnitude and spread of the frequencies presented in column 2. When classes are based on a single value, the middle of each histogram bar is placed directly over the single numerical value represented by the class. Also, the height of each bar in the frequency histogram matches the respective frequency in column 2. Copyright ยฉ 2020 Pearson Education, Inc. 64 Chapter 2 Figure (a) (d) 2.82 Figure (b) The relative-frequency histogram in Figure (b) is constructed using the relative-frequency distribution presented in part (b) of this exercise. It has the same horizontal axis as the frequency histogram. We notice that the relative frequencies presented in column 2 range in size from 0.025 to 0.325. Thus, suitable candidates for vertical-axis units in the relative-frequency histogram are increments of 0.05 (or 5%), from zero to 0.35 (or 35%). The middle of each histogram bar is placed directly over the single numerical value represented by the class. Also, the height of each bar in the relative-frequency histogram matches the respective relative frequency in column 2. (a) Since the data values range from 1 to 8, we construct a table with classes based on a single value. The resulting table follows. Litter Size Frequency 1 1 2 0 3 1 4 3 5 7 6 6 7 4 8 2 24 Copyright ยฉ 2020 Pearson Education, Inc. Section 2.3 65 (b) To get the relative frequencies, divide each frequency by the sample size of 24. Relative Frequency Litter Size 1 0.042 2 0.000 3 0.042 4 0.125 5 0.292 6 0.250 7 0.167 8 0.083 1.000 (c) The frequency histogram in Figure (a) is constructed using the frequency distribution presented in part (a) of this exercise. Column 1 demonstrates that the data are grouped using classes based on a single value. These single values in column 1 are used to label the horizontal axis of the frequency histogram. When classes are based on a single value, the middle of each histogram bar is placed directly over the single numerical value represented by the class. Also, the height of each bar in the frequency histogram matches the respective frequency in column 2. Figure (a) Figure (b) Litter Size Litter Size 30 7 25 6 20 Percent Frequency 5 4 3 10 2 5 1 0 15 1 2 3 4 5 6 7 8 0 1 2 3 SIZE (d) 4 5 6 7 8 SIZE The relative-frequency histogram in Figure (b) is constructed using the relative-frequency distribution presented in part (b) of this exercise. It has the same horizontal axis as the frequency histogram. We notice that the relative frequencies presented in column 2 range in size from 0.000 to 0.292. Thus, suitable candidates for vertical-axis units in the relative-frequency histogram are increments of 0.05 (or 5%), from zero to 0.30 (or 30%). The middle of each histogram bar is placed directly over the single numerical value represented by the class. Also, the height of each bar in the relative-frequency histogram matches the respective relative frequency in column 2. Copyright ยฉ 2020 Pearson Education, Inc. 66 Chapter 2 2.83 (a) Since the data values range from 0 to 5, we construct a table with classes based on a single value. The resulting table follows. Number of Computers 0 1 2 3 4 5 Frequency 5 22 11 2 4 1 45 (b) To get the relative frequencies, divide each frequency by the sample size of 45. The sum of the relative frequency column is 0.999 due to rounding Number of Computers 0 1 2 3 4 5 (c) Relative Frequency 0.111 0.489 0.244 0.044 0.089 0.022 0.999 The frequency histogram in Figure (a) is constructed using the frequency distribution presented in part (a) of this exercise. Column 1 demonstrates that the data are grouped using classes based on a single value. These single values in column 1 are used to label the horizontal axis of the frequency histogram. When classes are based on a single value, the middle of each histogram bar is placed directly over the single numerical value represented by the class. Also, the height of each bar in the frequency histogram matches the respective frequency in column 2. Figure (a) Figure (b) 25 50 40 15 Percent Frequency 20 10 20 5 0 30 10 0 1 2 3 4 5 0 0 1 COMPUTERS 2 3 4 5 COMPUTERS (d) The relative-frequency histogram in Figure (b) is constructed using the relative-frequency distribution presented in part (b) of this exercise. It has the same horizontal axis as the frequency histogram. The middle of each histogram bar is placed directly over the single numerical value represented by the class. Also, the height of each bar in the relative-frequency histogram matches the respective relative frequencies in column 2. 2.84 (a) The first class to construct is 40-49. Since all classes are to be of equal width, and the second class begins with 50, we know that the width of all classes is 50 – 40 = 10. All of the classes are presented Copyright ยฉ 2020 Pearson Education, Inc. Section 2.3 67 in column 1. The last class to construct is 150-159, since the largest single data value is 155. Having established the classes, we tally the energy consumption figures into their respective classes. These results are presented in column 2, which lists the frequencies. Consumption (mil. BTU) 40-49 50-59 60-69 70-79 80-89 90-99 100-109 110-119 120-129 130-139 140-149 150-159 (b) Frequency 1 7 7 3 6 10 5 4 2 3 0 2 50 Dividing each frequency by the total number of observations, which is 50, results in each class’s relative frequency. The relative frequencies for all classes are presented in column 2. The resulting table follows. Consumption (mil. BTU) 40-49 50-59 60-69 70-79 80-89 90-99 100-109 110-119 120-129 130-139 140-149 150-159 Relative Frequency 0.02 0.14 0.14 0.06 0.12 0.20 0.10 0.08 0.04 0.06 0.00 0.04 1.00 (c) The frequency histogram in Figure (a) is constructed using the frequency distribution presented in part (a) of this exercise. The lower class limits of column 1 are used to label the horizontal axis of the frequency histogram. Suitable candidates for vertical-axis units in the frequency histogram are the even integers 0 through 10, since these are representative of the magnitude and spread of the frequency presented in column 2. The height of each bar in the frequency histogram matches the respective frequency in column 2. (d) The relative-frequency histogram in Figure (b) is constructed using the relative-frequency distribution presented in part (b) of this exercise. It has the same horizontal axis as the frequency histogram. We notice that the relative frequencies presented in column 2 vary in size from 0.00 to 0.20. Thus, suitable candidates for vertical axis Copyright ยฉ 2020 Pearson Education, Inc. 68 Chapter 2 units in the relative-frequency histogram are increments of 0.05 (or 5%), from zero to 0.20 (or 20%). The height of each bar in the relative-frequency histogram matches the respective relative frequency in column 2. Figure (a) Figure (b) Histogram of ENERGY Histogram of ENERGY 20 10 15 6 Percent Frequency 8 5 2 0 2.85 10 4 40 50 60 70 80 90 100 110 ENERGY 120 130 140 150 160 0 40 50 60 70 80 90 100 110 ENERGY 120 130 140 150 160 (a) The first class to construct is 40-44. Since all classes are to be of equal width, and the second class begins with 45, we know that the width of all classes is 45 – 40 = 5. All of the classes are presented in column 1. The last class to construct is 60-64, since the largest single data value is 61. Having established the classes, we tally the age figures into their respective classes. These results are presented in column 2, which lists the frequencies. Age 40-44 45-49 50-54 55-59 60-64 (b) Dividing each frequency by the total number of observations, which is 21, results in each class’s relative frequency. The relative frequencies for all classes are presented in column 2. The resulting table follows. Age 40-44 45-49 50-54 55-59 60-64 (c) Frequency 4 3 4 8 2 21 Relative Frequency 0.190 0.143 0.190 0.381 0.095 1.000 The frequency histogram in Figure (a) is constructed using the frequency distribution presented in part (a) of this exercise. The lower class limits of column 1 are used to label the horizontal axis of the frequency histogram. Suitable candidates for vertical-axis units in the frequency histogram are the even integers 2 through 8, since these are representative of the magnitude and spread of the frequency presented in column 2. The height of each bar in the frequency histogram matches the respective frequency in column 2. Copyright ยฉ 2020 Pearson Education, Inc. Section 2.3 (d) 69 The relative-frequency histogram in Figure (b) is constructed using the relative-frequency distribution presented in part (b) of this exercise. It has the same horizontal axis as the frequency histogram. We notice that the relative frequencies presented in column 2 vary in size from 0.095 to 0.381. Thus, suitable candidates for vertical axis units in the relative-frequency histogram are increments of 0.10 (or 10%), from zero to 0.40 (or 40%). The height of each bar in the relative-frequency histogram matches the respective relative frequency in column 2. Figure (a) Figure (b) Early-Onset Dementia Early-Onset Dementia 9 40 8 7 30 5 Percent Frequency 6 4 20 3 10 2 1 0 40 45 50 55 60 65 0 40 45 AGE 2.86 50 55 60 65 AGE (a) The first class to construct is 20-22. Since all classes are to be of equal width, and the second class begins with 23, we know that the width of all classes is 23 – 20 = 3. All of the classes are presented in column 1. The last class to construct is 44-46, since the largest single data value is 46. Having established the classes, we tally the cheese consumption figures into their respective classes. These results are presented in column 2, which lists the frequencies. Cheese Consumption 20-22 23-25 26-28 29-31 32-34 35-37 38-40 41-43 44-46 (b) Frequency 1 3 5 3 5 9 2 4 3 35 Dividing each frequency by the total number of observations, which is 35, results in each class’s relative frequency. The relative frequencies for all classes are presented in column 2. The resulting table follows. The sum of the relative frequency column is 1.001 due to rounding. Copyright ยฉ 2020 Pearson Education, Inc. 70 Chapter 2 Cheese Consumption 20-22 23-25 26-28 29-31 32-34 35-37 38-40 41-43 44-46 Relative Frequency 0.029 0.086 0.143 0.086 0.143 0.257 0.057 0.114 0.086 1.001 (c) The frequency histogram in Figure (a) is constructed using the frequency distribution presented in part (a) of this exercise. The lower class limits of column 1 are used to label the horizontal axis of the frequency histogram. Suitable candidates for vertical-axis units in the frequency histogram are the even integers 2 through 7, since these are representative of the magnitude and spread of the frequency presented in column 2. The height of each bar in the frequency histogram matches the respective frequency in column 2. (d) The relative-frequency histogram in Figure (b) is constructed using the relative-frequency distribution presented in part (b) of this exercise. It has the same horizontal axis as the frequency histogram. We notice that the relative frequencies presented in column 2 vary in size from 0.057 to 0.200. Thus, suitable candidates for vertical axis units in the relative-frequency histogram are increments of 0.05 (or 5%), from zero to 0.20 (or 20%). The height of each bar in the relative-frequency histogram matches the respective relative frequency in column 2. Figure (a) Figure (b) 9 25 8 20 6 Percent Frequency 7 5 4 15 10 3 2 5 1 0 20 26 32 38 44 0 20 26 Cheese Consumption 2.87 32 38 44 Cheese Consumption (a) The first class to construct is 12-17. Since all classes are to be of equal width, and the second class begins with 18, we know that the width of all classes is 18 – 12 = 6. All of the classes are presented in column 1. The last class to construct is 60-65, since the largest single data value is 61. Having established the classes, we tally the anxiety questionnaire score figures into their respective classes. These results are presented in column 2, which lists the frequencies. Copyright ยฉ 2020 Pearson Education, Inc. Section 2.3 Anxiety 12-17 18-23 24-29 30-35 36-41 42-47 48-53 54-59 60-65 (b) 71 Frequency 2 3 6 5 10 4 0 0 1 31 Dividing each frequency by the total number of observations, which is 31, results in each class’s relative frequency. The relative frequencies for all classes are presented in column 2. The resulting table follows. Anxiety 12-17 18-23 24-29 30-35 36-41 42-47 48-53 54-59 60-65 Relative Frequency 0.065 0.097 0.194 0.161 0.323 0.129 0.000 0.000 0.032 1.000 (c) The frequency histogram in Figure (a) is constructed using the frequency distribution presented in part (a) of this exercise. The lower class limits of column 1 are used to label the horizontal axis of the frequency histogram. Suitable candidates for vertical-axis units in the frequency histogram are the even integers 0 through 10, since these are representative of the magnitude and spread of the frequency presented in column 2. The height of each bar in the frequency histogram matches the respective frequency in column 2. (d) The relative-frequency histogram in Figure (b) is constructed using the relative-frequency distribution presented in part (b) of this exercise. It has the same horizontal axis as the frequency histogram. We notice that the relative frequencies presented in column 2 vary in size from 0.000 to 0.323. Thus, suitable candidates for vertical axis units in the relative-frequency histogram are increments of 0.05 (or 5%), from zero to 0.35 (or 35%). The height of each bar in the relative-frequency histogram matches the respective relative frequency in column 2. Copyright ยฉ 2020 Pearson Education, Inc. 72 Chapter 2 Figure (a) Figure (b) Chronic Hemodialysis and Axiety Chronic Hemodialysis and Axiety 35 10 30 8 6 Percent Frequency 25 4 20 15 10 2 0 2.88 5 12 18 24 30 36 42 ANXIETY 48 54 60 0 66 12 18 24 30 36 42 ANXIETY 48 54 60 66 (a) The first class to construct is 4 โ€“ under 5. Since all classes are to be of equal width 1, the second class is 5 โ€“ under 6. All of the classes are presented in column 1. The last class to construct is 10 โ€“ under 11, since the largest single data value is 10.360. Having established the classes, we tally the audience sizes into their respective classes. These results are presented in column 2, which lists the frequencies. Audience (Millions) 4 โ€“ under 5 5 โ€“ under 6 6 โ€“ under 7 7 โ€“ under 8 8 โ€“ under 9 9 โ€“ under 10 10 โ€“ under 11 Frequency 1 6 7 1 3 1 1 20 (b) Dividing each frequency by the total number of observations, which is 20, results in each class’s relative frequency. The relative frequencies for all classes are presented in column 2. Audience (Millions) 4 โ€“ under 5 5 โ€“ under 6 6 โ€“ under 7 7 โ€“ under 8 8 โ€“ under 9 9 โ€“ under 10 10 โ€“ under 11 Relative 0.05 0.30 0.35 0.05 0.15 0.05 0.05 1.00 (c) The frequency histogram in Figure (a) is constructed using the frequency distribution obtained in part (a) of this exercise Column 1 demonstrates that the data are grouped using classes with class widths of 1. Also, the height of each bar in the frequency histogram matches the respective frequency in column 2. Copyright ยฉ 2020 Pearson Education, Inc. Section 2.3 (d) 73 The relative-frequency histogram in Figure (b) is constructed using the relative-frequency distribution obtained in part (b) of this exercise. It has the same horizontal axis as the frequency histogram. The height of each bar in the relative-frequency histogram matches the respective relative frequency in column 2. Figure (a) Figure (b) 40 7 6 30 Percent Frequency 5 4 3 2 20 10 1 0 4 5 6 7 8 9 10 11 0 4 5 6 AUDIENCE 2.89 7 8 9 10 11 AUDIENCE (a) The first class to construct is 52 โ€“ under 54. Since all classes are to be of equal width 2, the second class is 54 โ€“ under 56. All of the classes are presented in column 1. The last class to construct is 74 โ€“ under 76, since the largest single data value is 75.3. Having established the classes, we tally the cheetah speeds into their respective classes. These results are presented in column 2, which lists the frequencies. Speed 52 โ€“ under 54 54 โ€“ under 56 56 โ€“ under 58 58 โ€“ under 60 60 โ€“ under 62 62 โ€“ under 64 64 โ€“ under 66 66 โ€“ under 68 68 โ€“ under 70 70 โ€“ under 72 72 โ€“ under 74 74 โ€“ under 76 Frequency 2 5 6 8 7 3 2 1 0 0 0 1 35 (b) Dividing each frequency by the total number of observations, which is 35, results in each class’s relative frequency. The relative frequencies for all classes are presented in column 2 Copyright ยฉ 2020 Pearson Education, Inc. 74 Chapter 2 Speed 52 โ€“ under 54 54 โ€“ under 56 56 โ€“ under 58 58 โ€“ under 60 60 โ€“ under 62 62 โ€“ under 64 64 โ€“ under 66 66 โ€“ under 68 68 โ€“ under 70 70 โ€“ under 72 72 โ€“ under 74 74 โ€“ under 76 Relative Frequency 0.057 0.143 0.171 0.229 0.200 0.086 0.057 0.029 0.000 0.000 0.000 0.029 1.000 (c) The frequency histogram in Figure (a) is constructed using the frequency distribution obtained in part (a) of this exercise Column 1 demonstrates that the data are grouped using classes with class widths of 2. Suitable candidates for vertical axis units in the frequency histogram are the integers within the range 0 through 8, since these are representative of the magnitude and spread of the frequencies presented in column 2. Also, the height of each bar in the frequency histogram matches the respective frequency in column 2. (d) The relative-frequency histogram in Figure (b) is constructed using the relative-frequency distribution obtained in part (b) of this exercise. It has the same horizontal axis as the frequency histogram. We notice that the relative frequencies presented in column 3 range in size from 0.000 to 0.229. Thus, suitable candidates for vertical axis units in the relative-frequency histogram are increments of 0.05 (5%), from zero to 0.25 (25%). The height of each bar in the relativefrequency histogram matches the respective relative frequency in column 2. Figure (a) Figure (b) Speeds of Cheetahs Speeds of Cheetahs 25 9 8 20 7 Percent Frequency 6 5 4 15 10 3 2 5 1 0 2.90 52 54 56 58 60 62 64 66 SPEED 68 70 72 74 76 0 52 54 56 58 60 62 64 66 SPEED 68 70 72 74 76 (a) The first class to construct is 12 โ€“ under 14. Since all classes are to be of equal width 2, the second class is 14 โ€“ under 66. All of the classes are presented in column 1. The last class to construct is 26 โ€“ under 28, since the largest single data value is 26.4. Having established the classes, we tally the fuel tank capacities into their respective classes. These results are presented in column 2, which lists the frequencies. Copyright ยฉ 2020 Pearson Education, Inc. Section 2.3 75 Fuel Tank Capacity 12 โ€“ under 14 14 โ€“ under 16 16 โ€“ under 18 18 โ€“ under 20 20 โ€“ under 22 22 โ€“ under 24 24 โ€“ under 26 26 โ€“ under 28 Frequency 2 6 7 6 6 3 3 2 35 (b) Dividing each frequency by the total number of observations, which is 35, results in each class’s relative frequency. The relative frequencies for all classes are presented in column 2 Fuel Tank Capacity 12 โ€“ under 14 14 โ€“ under 16 16 โ€“ under 18 18 โ€“ under 20 20 โ€“ under 22 22 โ€“ under 24 24 โ€“ under 26 26 โ€“ under 28 Relative Frequency 0.057 0.171 0.200 0.171 0.171 0.086 0.086 0.057 1.000 The frequency histogram in Figure (a) is constructed using the frequency distribution obtained in part (a) of this exercise Column 1 demonstrates that the data are grouped using classes with class widths of 2. Suitable candidates for vertical axis units in the frequency histogram are the integers within the range 2 through 7, since these are representative of the magnitude and spread of the frequencies presented in column 2. Also, the height of each bar in the frequency histogram matches the respective frequency in column 2. (c) (d) The relative-frequency histogram in Figure (b) is constructed using the relative-frequency distribution obtained in part (b) of this exercise. It has the same horizontal axis as the frequency histogram. We notice that the relative frequencies presented in column 3 range in size from 0.057 to 0.200. Thus, suitable candidates for vertical axis units in the relative-frequency histogram are increments of 0.05 (5%), from zero to 0.20 (20%). The height of each bar in the relativefrequency histogram matches the respective relative frequency in column 2. Figure (a) Figure (b) Fuel Tank Capacity Fuel Tank Capacity 20 7 6 15 Percent Frequency 5 4 3 2 10 5 1 0 12 14 16 18 20 CAPACITY 22 24 26 28 0 12 14 16 18 Copyright ยฉ 2020 Pearson Education, Inc. 20 CAPACITY 22 24 26 28 76 Chapter 2 2.91 (a) The first class to construct is 0 โ€“ under 1. Since all classes are to be of equal width 1, the second class is 1 โ€“ under 2. All of the classes are presented in column 1. The last class to construct is 7 – under 8, since the largest single data value is 7.6. Having established the classes, we tally the fuel tank capacities into their respective classes. These results are presented in column 2, which lists the frequencies. Oxygen Distribution 0 โ€“ under 1 1 โ€“ under 2 2 โ€“ under 3 3 โ€“ under 4 4 โ€“ under 5 5 โ€“ under 6 6 โ€“ under 7 7 โ€“ under 8 Frequency 1 10 5 4 0 0 1 1 22 (b) Dividing each frequency by the total number of observations, which is 22, results in each class’s relative frequency. The relative frequencies for all classes are presented in column 2 Oxygen Distribution 0 โ€“ under 1 1 โ€“ under 2 2 โ€“ under 3 3 โ€“ under 4 4 โ€“ under 5 5 โ€“ under 6 6 โ€“ under 7 7 โ€“ under 8 (c) (d) Relative Frequency 0.045 0.455 0.227 0.182 0.000 0.000 0.045 0.045 1.000 The frequency histogram in Figure (a) is constructed using the frequency distribution obtained in part (a) of this exercise Column 1 demonstrates that the data are grouped using classes with class widths of 2. Suitable candidates for vertical axis units in the frequency histogram are the integers within the range 0 through 10, since these are representative of the magnitude and spread of the frequencies presented in column 2. Also, the height of each bar in the frequency histogram matches the respective frequency in column 2. The relative-frequency histogram in Figure (b) is constructed using the relative-frequency distribution obtained in part (b) of this exercise. It has the same horizontal axis as the frequency histogram. We notice that the relative frequencies presented in column 3 range in size from 0.000 to 0.455. Thus, suitable candidates for vertical axis units in the relative-frequency histogram are increments of 0.05 (5%), from zero to 0.50 (50%). The height of each bar in the relativefrequency histogram matches the respective relative frequency in column 2. Copyright ยฉ 2020 Pearson Education, Inc. Section 2.3 Figure (a) Figure (b) Oxygen Distribution Oxygen Distribution 50 10 40 6 2.92 Percent Frequency 8 30 4 20 2 10 0 77 0 1 2 3 4 OXYGEN 5 6 7 0 8 0 1 2 3 4 OXYGEN 5 6 7 8 The horizontal axis of this dotplot displays a range of possible exam scores. To complete the dotplot, we go through the data set and record each exam score by placing a dot over the appropriate value on the horizontal axis. Dotplot of SCORE 36 45 54 63 72 81 90 99 SCORE 2.93 The horizontal axis of this dotplot displays of range of possible ages of the passenger cars. To complete the dotplot, we go through the data set and record each age by placing a dot over the appropriate value on the horizontal axis. Dotplot of AGE 2 3 4 5 6 7 8 9 10 11 1 2 1 3 1 4 1 5 1 6 1 7 1 8 1 9 20 21 22 23 24 AGE of Passenger Cars Copyright ยฉ 2020 Pearson Education, Inc. 78 Chapter 2 2.94 (a) The data values range from 52 to 84, so the scale must accommodate those values. We stack dots above each value on two different lines using the same scale for each line. The result is Dotplot of INTERVENTION, CONTROL INTERVENTION CONTROL 55 60 65 70 75 80 85 Data 2.95 (b) The two sets of pulse rates are both centered near 68, but the Intervention data are more concentrated around the center than are the Control data. (a) The data values range from 7 to 18, so the scale must accommodate those values. We stack dots above each value on two different lines using the same scale for each line. The result is Dotplot of DYNAMIC, STATIC DYNAMIC STATIC (b) 6 8 10 12 Data 14 16 18 The Dynamic system does seem to reduce acute postoperative days in the hospital on the average. The Dynamic data are centered at about 7 days, whereas the Static data are centered at about 11 days and are much more spread out than the Dynamic data. Copyright ยฉ 2020 Pearson Education, Inc. Section 2.3 2.96 The data values consist of 2 digit numbers followed by a one digit decimal place ranging from 45.5 to 57.0. The last digit following the decimal will be the leaves and the stems will be the remaining digits. Therefore, the stem-and-leaf diagram will have stems of 45 through 57. 45| 46| 47| 48| 49| 50| 51| 52| 53| 54| 55| 56| 57| 2.97 5 4 2 0 1 3578 35589 011 355689 13 033 0 0 Since each data value consists of 2 digits, each beginning with 1, 2, 3, or 4, we will construct the stem-and-leaf diagram with these four values as the stems. The result is 1| 2| 3| 4| 2.98 79 (a) Since each data value consists of a 2 digit number with a one digit decimal, we will make the leaf the decimal digit and the stems the remaining two digit numbers of 28, 29, 30, and 31. The result is 28| 29| 30| 31| (b) 8 368 1247 02 Splitting into two lines per stem, leafs of 0-4 belong in the first stem and leafs of 5-9 belong in the second stem. The result is 28| 29| 29| 30| 30| 31| (c) 238 1678899 34459 04 8 3 68 124 7 02 The stem-and-leaf diagram in part (b) is more useful because by splitting the stems into two lines per stem, you have created more lines. Part (a) had too few lines. Copyright ยฉ 2020 Pearson Education, Inc. 80 Chapter 2 2.99 (a) Since each data value lies between 2 and 93, we will construct the stem-and-leaf diagram with one line per stem. The result is 0| 1| 2| 3| 4| 5| 6| 7| 8| 9| (b) 2234799 11145566689 023479 004555 19 5 9 9 3 Using two lines per stem, the same data result in the following diagram: 0| 2234 0| 799 1| 1114 1| 5566689 2| 0234 2| 79 3| 004 3| 555 4| 1 4| 9 5| 5| 5 6| 6| 9 7| 7| 9 8| 8| 9| 3 (c) The stem with one line per stem is more useful. One gets the same impression regarding the shape of the distribution, but the two lines per stem version has numerous lines with no data, making it take up more space than necessary to interpret the data and giving it too many lines. 2.100 (a) Since we have two digit numbers, the last digit becomes the leaf and the first digit becomes the stem. For this data, we have a stem of 7. Splitting the data into five lines per stem, we put the leaves 0-1 in the first stem, 2-3 in the second stem, 4-5 in the third stem, 6-7 in the fourth stem, and 8-9 in the fifth stem. The result is 7| 7| 7| 7| 001111111 2222223333333 444444445555 66666666677 (b) Using one or two lines per stem would have given us too few lines. 2.101 (a) Since we have two digit numbers, the last digit becomes the leaf and the first digit becomes the stem. For this data, we have stems of 6, 7, and 8. Splitting the data into five lines per stem, we put the leaves 0-1 in the first stem, 2-3 in the second stem, 4-5 in the third stem, 6-7 in the fourth stem, and 8-9 in the fifth stem. The result is Copyright ยฉ 2020 Pearson Education, Inc. Section 2.3 6| 7| 7| 7| 7| 7| 8| (b) 81 8 11111111 222222222233333 4444555555 66666777777 8 0 Using one or two lines per stem would have given us too few lines. 2.102 The heights of the bars of the relative-frequency histogram indicate that: (a) About 27.5% of the returns had an adjusted gross income between $10,000 and $19,999, inclusive. (b) About 37.5% were between $0 and $9,999; 27.5% were between $10,000 and $19,999; and 19% were between $20,000 and $29,999. Thus, about 84% (i.e., 37.5% + 27.5% + 19%) of the returns had an adjusted gross income less than $30,000. (c) About 11% were between $30,000 and $39,999; and 5% were between $40,000 and $49,999. Thus, about 16% (i.e., 11% + 5%) of the returns had an adjusted gross income between $30,000 and $49,999. With 89,928,000 returns having an adjusted gross income less than $50,000, the number of returns having an adjusted gross income between $30,000 and $49,999 was 14,388,480 (i.e., 0.16 x 89,928,000). 2.103 The graph indicates that: (a) 20% of the patients have cholesterol levels between 205 and 209, inclusive. (b) 20% are between 215 and 219; and 5% are between 220 and 224. Thus, 25% (i.e., 20% + 5%) have cholesterol levels of 215 or higher. (c) 35% of the patients have cholesterol levels between 210 and 214, inclusive. With 20 patients in total, the number having cholesterol levels between 210 and 214 is 7 (i.e., 0.35 x 20). 2.104 The graph indicates that: (a) 15 states had at least three but less than four hospital beds per 1000 people available. (b) 3 states had at least four and a half hospital beds per 1000 people available. 2.105 The graph indicates that: (a) 1 of these 14 patients was under 45 years old at the onset of symptoms. (b) 3 of these 14 patients were at least 65 years old at the onset of symptoms. (c) 8 of these 14 patients were between 50 and 64 years old, inclusive, at the onset of symptoms. 2.106 (a) Using Minitab, retrieve the data from the WeissStats Resource Site. Column 1 contains the numbers of pups borne in a lifetime for each of 80 female Great White Sharks. From the tool bar, select Stat ๏€ผ Tables ๏€ผ Tally Individual Variables, double-click on PUPS in the first box so that PUPS appears in the Variables box, put a check mark next to Counts and Percents under Display, and click OK. The result is Copyright ยฉ 2020 Pearson Education, Inc. 82 Chapter 2 PUPS Count Percent 3 2 2.50 4 5 6.25 5 10 12.50 6 11 13.75 7 17 21.25 8 17 21.25 9 11 13.75 10 4 5.00 11 2 2.50 12 1 1.25 (b) After retrieving the data from the WeissStats Resource Site, select ๏€ผ Histogram, choose Simple and click OK. Double click on PUPS in Graph the first box to enter PUPS in the Graphs variables box, and click OK. The frequency histogram is Histogram of PUPS 18 16 14 Frequency 12 10 8 6 4 2 0 4 6 8 10 12 PUPS To change to a relative-frequency histogram, before clicking OK the second time, click on the Scale button and the Y-Scale type tab, and choose Percent and click OK. The graph will look like the frequency histogram, but will have relative frequencies on the vertical scale instead of counts. The numbers of pups range from 1 to 12 per female with 7 and 8 pups occurring more frequently than any other values. 2.107 (a) Using Minitab, there is not a direct way to get a grouped frequency distribution. However, you can use an option in creating your histogram that will report the frequencies in each of the classes, essentially creating a grouped frequency distribution. Retrieve the data from the WeissStats Resource Site. Column 2 contains the length ๏€ผ of the Beatles songs, in seconds. From the tool bar, select Graph Histogram, choose Simple and click OK. Double click on LENGTH to enter LENGTH in the Graph variables box. Click Labels, click the Data Labels tab, then check Use y-value labels. Click OK twice. The result is Copyright ยฉ 2020 Pearson Education, Inc. Section 2.3 83 70 70 60 54 Frequency 50 42 40 30 20 17 13 9 10 3 1 0 8 3 3 75 1 50 1 225 1 0 1 0 300 375 1 0 1 1 450 LENGTH Above each bar is a label for each of the frequencies. Also, the labeling on the horizontal axis is the midpoint for class, where each class has a width of 25. To change the width of the bars, right Click on the bars and choose Edit Bars, click Binning, click Midpoint/Cutpoint positions:, type 0 50 100 150 200 250 300 350 400 450 500. The result is 1 40 124 1 20 Frequency 1 00 80 60 42 40 32 18 20 1 0 5 0 2 1 00 200 300 1 1 400 2 1 500 LENGTH To get the relative-frequency distribution, follow the same steps as above, but also Click the Scale button, click the Y-scale Type, check Percent, then click OK twice. The result is 60 54.1485 50 Percent 40 30 18.3406 20 13.9738 7.86026 10 0 0.436681 0 2.18341 0.873362 0.436681 0.436681 0.873362 0.436681 1 00 200 300 400 500 LENGTH Above each bar is the percentage for that class, essentially creating a relative-frequency distribution. You could also transfer these results into a table. (b) A frequency histogram and a relative frequency distribution were created in part (a). Copyright ยฉ 2020 Pearson Education, Inc. 84 Chapter 2 ๏€ผ (c) To obtain the dotplot, select Graph Dotplot, select Simple in the One Y row, and click OK. Double click on LENGTH to enter LEGNTH in the Graph variables box and click OK. The result is Dotplot of LENGTH 70 1 40 21 0 280 350 420 490 LENGTH (d) The graphs are similar, but not identical. This is because the dotplot preserves the raw data by plotting individual dots and the histogram looses the raw data because it groups observations into grouped classes. The overall impression, however, remains the same. They both are generally the same shape with outliers to the right. 2.108 (a) After entering the data from the WeissStats Resource Site, in Minitab, ๏€ผ select Graph Stem-and-Leaf, double click on PERCENT to enter PERCENT in the Graph variables box and enter a 10 in the Increment box, and click OK. The result is Stem-and-leaf of PERCENT Leaf Unit = 1.0 (35) 16 8 9 N = 51 00122223334444455566777777888889999 0000000001111122 (b) Repeat part (a), but this time enter a 5 in the Increment box. result is Stem-and-leaf of PERCENT Leaf Unit = 1.0 15 (20) 16 8 8 9 N The = 51 001222233344444 55566777777888889999 0000000001111122 (c) Repeat part (a) again, but this time enter a 2 in the Increment box. The result is Stem-and-leaf of PERCENT Leaf Unit = 1.0 3 10 18 (8) 25 16 2 8 8 8 8 8 9 9 N = 51 001 2222333 44444555 66777777 888889999 00000000011111 22 Copyright ยฉ 2020 Pearson Education, Inc. Section 2.3 85 (d) The last graph is the most useful since it gives a better idea of the shape of the distribution. Typically, we like to have five to fifteen classes and this is the only one of the three graphs that satisfies that condition. 2.109 (a) After entering the data from the WeissStats Resource Site, in Minitab, ๏€ผ select Graph Stem-and-Leaf, double click on PERCENT to enter PERCE T in the Graph variables box and enter a 10 in the Increment box, and click OK. The result is Stem-and-leaf of PERCENT Leaf Unit = 1.0 2 (32) 17 1 1 2 3 4 N = 51 79 01122333444455555566666777778999 0001112223456668 9 (b) Repeat part (a), but this time enter a 5 in the Increment box. result is Stem-and-leaf of PERCENT Leaf Unit = 1.0 2 14 (20) 17 6 1 1 1 2 2 3 3 4 4 N The = 51 79 011223334444 55555566666777778999 00011122234 56668 9 (c) Repeat part (a) again, but this time enter a 2 in the Increment box. The result is Stem-and-leaf of PERCENT Leaf Unit = 1.0 1 2 5 10 20 (10) 21 17 11 7 5 2 1 1 1 1 1 1 1 2 2 2 2 2 3 3 3 3 3 4 4 4 4 4 N = 51 7 9 011 22333 4444555555 6666677777 8999 000111 2223 45 666 8 9 (d) The second graph is the most useful. The third one has more classes than necessary to comprehend the shape of the distribution and has a number of empty stems. Typically, we like to have five to fifteen classes and the first and second diagrams satisfy that condition, but the second one provides a better idea of the shape of the distribution. Copyright ยฉ 2020 Pearson Education, Inc. 86 Chapter 2 2.110 (a) After entering the data from the WeissStats Resource Site, in Minitab, ๏€ผ Histogram, select Simple and click OK. double click on select Graph TEMP to enter TEMP in the Graph variables box and click OK. The result is Histogram of TEMP 20 Frequency 15 10 5 0 97.0 97.5 98.0 TEMP 98.5 99.0 99.5 ๏€ผ Dotplot, select Simple in the One Y row, and click (b) Now select Graph OK. Double click on TEMP to enter TEMP in the Graph variables box and click OK. The result is Dotplot of TEMP 96.8 97.2 97.6 98.0 TEMP 98.4 98.8 99.2 ๏€ผ Stem-and-Leaf, double click on TEMP to enter TEMP in (c) Now select Graph the Graph variables box and click OK. Leave the Increment box blank to allow Minitab to choose the number of lines per stem. The result is Stem-and-leaf of TEMP N Leaf Unit = 0.10 1 96 7 3 96 89 8 97 00001 13 97 22233 19 97 444444 26 97 6666777 31 97 88889 45 98 00000000000111 (10) 98 2222222233 38 98 4444445555 28 98 66666666677 17 98 8888888 10 99 00001 5 99 2233 1 99 4 = 93 Copyright ยฉ 2020 Pearson Education, Inc. Section 2.3 87 (d) The dotplot shows all of the individual values. The stem-and-leaf diagram used five lines per stem and therefore each line contains leaves with possibly two values. The histogram chose classes of width 0.25. This resulted in, for example, the class with midpoint 97.0 including all of the values 96.9, 97.0, and 97.1, while the class with midpoint 97.25 includes only the two values 97.2 and 97.3. Thus the โ€˜smoothingโ€™ effect is not as good in the histogram as it is in the stem-and-leaf diagram. Overall, the dotplot gives the truest picture of the data and allows recovery of all of the data values. 2.111 (a) The classes are presented in column 1. With the classes established, we then tally the exam scores into their respective classes. These results are presented in column 2, which lists the frequencies. Dividing each frequency by the total number of exam scores, which is 20, results in each class’s relative frequency. The relative frequencies for all classes are presented in column 3. The class mark of each class is the average of the lower and upper limits. The class marks for all classes are presented in column 4. Score Frequency Relative Frequency 30-39 40-49 50-59 60-69 70-79 80-89 90-100 2 0 0 3 3 8 4 0.10 0.00 0.00 0.15 0.15 0.40 0.20 20 1.00 Class Mark 34.5 44.5 54.5 64.5 74.5 84.5 95.0 (b) The first six classes have width 10; the seventh class had width 11. (c) Answers will vary, but one choice is to keep the first six classes the same and make the next two classes 90-99 and 100-109. Another possibility is 31-40, 41-50, โ€ฆ, 91-100. 2.112 Answers will vary, but by following the steps we first decide on the approximate number of classes. Since there are 40 observations, we should have 7-14 classes. This exercise states we should have approximately seven classes. Step 2 says that we calculate an approximate class width as (99 โ€“ 36)/7 = 9. A convenient class width close to 9 would be a class width of 10. Step 3 says that we choose a number for the lower class limit which is less than or equal to our minimum observation of 36. Letโ€™s choose 35. Beginning with a lower class limit of 35 and width of 10, we have a first class of 35-44, a second class of 45-54, a third class of 55-64, a fourth class of 65-74, a fifth class of 75-84, a sixth class of 85-94, and a seventh class of 95-104. This would be our last class since the largest observation is 99. 2.113 Answers will vary, but by following the steps we first decide on the approximate number of classes. Since there are 37 observations, we should have 7-14 classes. This exercise states we should have approximately eight classes. Step 2 says that we calculate an approximate class width as (278.8 โ€“ 129.2)/8 = 18.7. A convenient class width close to 18.7 would be a class width of 20. Step 3 says that we choose a number for the lower cutpoint which is less than or equal to our minimum observation of 129.2. Letโ€™s choose 120. Beginning with a lower cutpoint of 120 and width of 20, we have a first class of 120 โ€“ under 140, a second class of 140 โ€“ under 160, a third class of 160 โ€“ under 180, a fourth class of 180 – under 200, a fifth Copyright ยฉ 2020 Pearson Education, Inc. 88 Chapter 2 class of 200 โ€“ under 220, a sixth class of 220 โ€“ under 240, a seventh class of 240 โ€“ under 260, and an eighth class of 260 โ€“ under 280. This would be our last class since the largest observation is 278.8. 2.114 (a) Tally marks for all 50 students, where each student is categorized by age and gender, are presented in the contingency table given in part (b). (b) Tally marks in each box appearing in the following chart are counted. These counts, or frequencies, replace the tally marks in the contingency table. For each row and each column, the frequencies are added, and their sums are recorded in the proper “Total” box. Age (yrs) Gender Under 21 21 – 25 Over 25 Male ||||| ||| ||||| || ||||| || Female ||||| || ||||| ||||| ||| ||||| ||| Total Total Age (yrs) Gender Under 21 21-25 Over 25 Total Male 8 12 2 22 Female 12 13 3 28 Total 20 25 5 50 (c) The row and column totals represent the total number of students in each of the corresponding categories. For example, the row total of 22 indicates that 22 of the students in the class are male. (d) The sum of the row totals is 50, and the sum of the column totals is 50. The sums are equal because they both represent the total number of students in the class. (e) Dividing each frequency reported in part (b) by the grand total of 50 students results in a contingency table that gives relative frequencies. Age (yrs) Under 21 21-25 Over 25 Total Male 0.16 0.24 0.04 0.44 Female 0.24 0.26 0.06 0.56 Total 0.40 0.50 0.10 1.00 Gender (f) The 0.16 in the upper left-hand cell indicates that 16% of the students in the class are males and under 21. The 0.40 in the lower left-hand cell indicates that 40% of the students in the class are under age 21. A similar interpretation holds for the remaining entries. Copyright ยฉ 2020 Pearson Education, Inc. Section 2.3 89 2.115 Consider columns 1 and 2 of the energy-consumption data given in Exercise 2.56 part (b). Compute the class mark for each class presented in column 1. Pair each class mark with its corresponding relative frequency found in column 2. Construct a horizontal axis, where the units are in terms of class marks and a vertical axis where the units are in terms of relative frequencies. For each class mark on the horizontal axis, plot a point whose height is equal to the relative frequency of the class. Then join the points with connecting lines. The result is a relative-frequency polygon. Residential Energy Consumption Relative Frequency 0.25 0.20 0.15 0.10 0.05 0.00 35 45 55 65 75 85 95 105 115 125 135 145 155 165 BTU (Millions) 2.116 Consider columns 1 and 2 of the Cheetah speed data given in Exercise 2.61 part (b). Compute the midpoint for each class presented in column 1. Pair each midpoint with its corresponding relative frequency found in column 2. Construct a horizontal axis, where the units are in terms of midpoints and a vertical axis where the units are in terms of relative frequencies. For each midpoint on the horizontal axis, plot a point whose height is equal to the relative frequency of the class. Then join the points with connecting lines. The result is a relative-frequency polygon. Cheetah Speeds 0.25 Relative Frequency 0.20 0.15 0.10 0.05 0.00 53 55 57 59 61 63 65 Speed (mph) 67 69 71 73 75 2.117 In single value grouping the horizontal axis would be labeled with the value of each class. 2.118 (a) Consider parts (a) and (b) of the energy-consumption data given in Exercise 2.56. The classes are now reworked to present just the lower class limit of each class. The frequencies are reworked to sum the frequencies of all classes representing values less than the specified lower class limit. These successive sums are the cumulative frequencies. The relative frequencies are reworked to sum the relative frequencies of all classes representing values less than the specified class limits. These successive sums are the cumulative relative frequencies. (Note: The cumulative relative frequencies can also be found by dividing the each cumulative frequency by the total number of data values.) Copyright ยฉ 2020 Pearson Education, Inc. 90 Chapter 2 Less than (b) Cumulative Frequency Cumulative Relative Frequency 40 0 0.00 50 1 0.02 60 8 0.16 70 15 0.30 80 18 0.36 90 24 0.48 100 34 0.68 110 39 0.78 120 43 0.86 130 45 0.90 140 48 0.96 150 48 0.96 160 50 1.00 Pair each class limit with its corresponding cumulative relative frequency found in column 3. Construct a horizontal axis, where the units are in terms of the class limits and a vertical axis where the units are in terms of cumulative relative frequencies. For each class limit on the horizontal axis, plot a point whose height is equal to the cumulative relative frequency. Then join the points with connecting lines. The result, presented in the following figure, is an ogive using cumulative relative frequencies. (Note: A similar procedure could be followed using cumulative frequencies.) Cumulative Relative Frequency Residential Energy Consum ption 1.2 1 0.8 0.6 0.4 0.2 0 20 30 40 50 60 70 80 90 10 11 12 13 14 15 16 0 0 0 0 0 0 0 BTU (Millions) 2.119 (a) Consider parts (a) and (b) of the Cheetah speed data given in Exercise 2.61. The classes are now reworked to present just the lower cutpoint of each class. The frequencies are reworked to sum the frequencies of all classes representing values less than the specified lower cutpoint. These successive sums are the cumulative frequencies. The relative frequencies are reworked to sum the relative frequencies of all classes representing values less than the specified cutpoints. These successive sums are the cumulative relative frequencies. (Note: The cumulative relative frequencies can also be found by dividing the each cumulative frequency by the total number of data values.) Copyright ยฉ 2020 Pearson Education, Inc. Section 2.3 (b) Less than Cumulative Frequency 52 54 56 58 60 62 64 66 68 70 72 74 76 0 2 7 13 21 28 31 33 34 34 34 34 35 91 Cumulative Relative Frequency 0.000 0.057 0.200 0.371 0.600 0.800 0.886 0.943 0.971 0.971 0.971 0.971 1.000 Pair each cutpoint with its corresponding cumulative relative frequency found in column 3. Construct a horizontal axis, where the units are in terms of the cutpoints and a vertical axis where the units are in terms of cumulative relative frequencies. For each cutpoint on the horizontal axis, plot a point whose height is equal to the cumulative relative frequency. Then join the points with connecting lines. The result, presented in the following figure, is an ogive using cumulative relative frequencies. (Note: A similar procedure could be followed using cumulative frequencies.) Clocking the Cheetah Cumulative Relative Frequency 1.0 0.8 0.6 0.4 0.2 0.0 52 54 56 58 60 62 64 66 Speed (mph) 68 70 72 74 76 2.120 (a) After rounding each observation to the nearest year, the stem-and-leaf diagram for the rounded ages is 5| 6| 7| 8| 9| 334469 6 256689 234678 8 (b) After truncating each weight by dropping the decimal part, the stemand-leaf diagram for the rounded weights is 5| 6| 7| 8| 9| 223468 5 245688 123678 7 Copyright ยฉ 2020 Pearson Education, Inc. 92 Chapter 2 (c) Although there are minor differences between the two diagrams, the overall impression of the distribution of weights is the same for both diagrams. 2.121 Minitab used truncation. Note that there was a data point of 5.8 in the sample. It would have been plotted with a stem of 0 and a leaf of 6 if it had been rounded. Instead Minitab plotted the observation with a stem of 0 and a leaf of 5. Section 2.4 2.122 The distribution of a data set is a table, graph, or formula that provides the values of the observations and how often they occur. 2.123 Sample data are the values of a variable for a sample of the population. 2.124 Population data are the values of a variable for the entire population. 2.125 A sample distribution is the distribution of sample data. 2.126 A population distribution is the distribution of population data. 2.127 A distribution of a variable is the same as a population distribution. 2.128 A smooth curve makes it a little easier to see the shape of a distribution and to concentrate on the overall pattern without being distracted by minor differences in shape. 2.129 A large simple random sample from a bell-shaped distribution would be expected to have roughly a bell-shaped distribution since more sample values should be obtained, on average, from the middle of the distribution. 2.130 (a) Yes. We would expect both simple random samples to have roughly a reverse J-shaped distribution. (b) Yes. We would expect some variation in shape between the two sample distributions since it is unlikely that the two samples would produce exactly the same frequency table. It should be noted, however, that as the sample size is increased, the difference in shape for the two samples should become less noticeable. 2.131 Three distribution shapes that are symmetric are bell-shaped, triangular, and Uniform (or rectangular), shown in that order below. It should be noted that there are others as well. Bell-shaped Triangular 2.132 (a) The shape of the distribution is unimodal. (b) The shape of the distribution is symmetric. 2.133 (a) The shape of the distribution is unimodal. (b) The shape of the distribution is symmetric. 2.134 (a) The shape of the distribution is unimodal. (b) The shape of the distribution is not symmetric. (c) The shape of the distribution is right-skewed. Copyright ยฉ 2020 Pearson Education, Inc. Uniform (or rectangular) Section 2.4 93 2.135 (a) The shape of the distribution is unimodal. (b) The shape of the distribution is not symmetric. (c) The shape of the distribution is left-skewed. 2.136 (a) The shape of the distribution is unimodal. (b) The shape of the distribution is not symmetric. (c) The shape of the distribution is right-skewed. 2.137 (a) The shape of the distribution is unimodal. (b) The shape of the distribution is not symmetric. (c) The shape of the distribution is left-skewed. 2.138 (a) The shape of the distribution is bimodal. (b) The shape of the distribution is symmetric. 2.139 (a) The shape of the distribution is multimodal. (b) The shape of the distribution is not symmetric. 2.140 The overall shape of the distribution of the number of children of U.S. presidents is right skewed. 2.141 Except for the one data value between 74 and 76, this distribution is close to bell-shaped. That one value makes the distribution slightly right skewed. 2.142 The distribution of weights of the male Ethiopian born school children is roughly symmetric. 2.143 The distribution of depths of the burrows is left skewed. 2.144 The distribution of heights of the Baltimore Ravens is roughly symmetric. 2.145 The distribution of PCB concentration is symmetric. 2.146 The distribution of adjusted gross incomes is right skewed. 2.147 The distribution of cholesterol levels appears to be slightly left skewed. 2.148 The distribution of hemoglobin levels for patients with sickle cell disease is roughly symmetric. 2.149 The distribution of length of stay is right skewed. 2.150 (a) The frequency distribution for this data is shown in the following table. Time Between Eruptions (minutes) Frequency 60 โ€“ under 70 3 70 โ€“ under 80 1 80 โ€“ under 90 6 90 โ€“ under 100 12 100 โ€“ under 110 9 110 โ€“ under 120 1 Copyright ยฉ 2020 Pearson Education, Inc. 94 Chapter 2 The histogram for the distribution is shown below. 12 10 Frequency 8 6 4 2 0 60 70 80 90 1 00 110 1 20 TIME (b) This distribution is unimodal. (c) This distribution is not symmetric. (d) This distribution is left skewed. 2.151 (a) (b) (c) (d) 2.152 The distributions for Year 1 and Year 2 are both unimodal. Both distributions are not symmetric. Both distributions are right skewed. The distribution for Year 1 has a longer right tail indicating more variation than the distribution for Year 2. They are also not centered in the same place. (a) After entering the data from the WeissStats Resource Site, in ๏€ผ Minitab, select Graph Histogram, select Simple and click OK. Double click on PUPS to enter PUPS in the Graph variables box and click OK. Our result is as follows. Results may vary depending on the type of technology used and graph obtained. The overall shape of the distribution is unimodal and symmetric. Histogram of PUPS 18 16 14 Frequency 12 10 8 6 4 2 0 4 6 8 10 12 PUPS 2.153 (a) After entering the data from the WeissStats Resource Site, in ๏€ผ Minitab, select Graph Histogram, select Simple and click OK. Double click on LENGTH to enter LENGTH in the Graph variables box and click OK. Our result is as follows. Results may vary depending on the type of technology used and graph obtained. Copyright ยฉ 2020 Pearson Education, Inc. Section 2.4 95 70 60 Frequency 50 40 30 20 10 0 75 1 50 225 300 375 450 LENGTH The distribution of LENGTH is unimodal and not symmetric. (b) The distribution is right skewed. 2.154 (a) In Exercise 2.108, we used Minitab to obtain a stem-and-leaf diagram using 5 lines per stem. That diagram is shown below Stem-and-leaf of PERCENT Leaf Unit = 1.0 3 8 001 10 8 2222333 18 8 44444555 (8) 8 66777777 25 8 888889999 16 9 00000000011111 2 9 22 N = 51 The overall shape of this distribution is unimodal and not symmetric. (b) The distribution is left skewed. 2.155 (a) In Exercise 2.109, we used Minitab to obtain a stem-and-leaf diagram using 2 lines per stem. That diagram is shown below. Stem-and-leaf of PERCENT Leaf Unit = 1.0 2 14 (20) 17 6 1 1 1 2 2 3 3 4 4 N = 51 79 011223334444 55555566666777778999 00011122234 56668 9 The overall shape of this distribution is unimodal and roughly symmetric. 2.156 ๏€ผ (a) After entering the data in Minitab, select Graph Dotplot, select Simple in the One Y row, and click OK. Double click on TEMP to enter TEMP in the Graph variables box and click OK. Our result is as follows. Results may vary depending on the type of technology used and graph obtained. Copyright ยฉ 2020 Pearson Education, Inc. 96 Chapter 2 Dotplot of TEMP 96.8 97.2 97.6 98.0 TEMP 98.4 98.8 99.2 The overall distribution of temperatures is roughly unimodal and roughly symmetric. (a) After entering the data from the WeissStats Resource Site, in 2.157 ๏€ผ Minitab, select Graph Histogram, select Simple and click OK. Double click on LENGTH to enter LENGTH in the Graph variables box and click OK. Our result is as follows. Results may vary depending on the type of technology used and graph obtained. Histogram of LENGTH 30 25 Frequency 20 15 10 5 0 16 17 18 19 LENGTH 20 21 The distribution of LENGTH is approximately unimodal and symmetric. 2.158 Class Project. class. The precise answers to this exercise will vary from class to 2.159 The precise answers to this exercise will vary from class to class or individual to individual. Thus your results will likely differ from our results shown below. (a) We obtained 50 random digits from a table of random numbers. digits were The 4 5 4 6 8 9 9 7 7 2 2 2 9 3 0 3 4 0 0 8 8 4 4 5 3 9 2 4 8 9 6 3 0 1 1 0 9 2 8 1 3 9 2 5 8 1 8 9 2 2 (b) Since each digit is equally likely in the random number table, we expect that the distribution would look roughly uniform. Copyright ยฉ 2020 Pearson Education, Inc. Section 2.4 (c) 97 Using single value classes, the frequency distribution is given by the following table. The relative frequency histogram is shown below. Value Frequency Relative-Frequency 0 5 .10 1 4 .08 2 8 .16 3 5 .10 4 6 .12 5 3 .06 6 2 .04 7 2 .04 8 7 .14 9 8 .16 0.18 0.16 0.14 0.12 0.10 0.08 0.06 0.04 0.02 0.00 0 1 2 3 4 5 6 7 8 9 We did not expect to see this much variation. (d) We would have expected a histogram that was a little more โ€˜evenโ€™, more like a uniform distribution, but the relatively small sample size can result in considerable variation from what is expected. (e) We should be able to get a more uniformly distributed set of data if we choose a larger set of data. (f) Class project. 2.160 (a-c) Your results will differ from the ones below which were obtained using Excel. Enter a name for the data in cell A1, say RANDNO. Click on cell A2 and enter =RANDBETWEEN(0,9). Then copy this cell into cells A3 to A51. There are two ways to produce a histogram of the resulting data in Excel. The easier way is to highlight A1-A51 with the mouse, click on the toolbar, select Graphs and Plots, then choose Histogram in the Function type box. Now click on RANDNO in the Names and Columns box and drag the name into the Quantitative Variables box. Then click OK. A graph and a summary table will be produced. To get five more samples, simply go back to the spreadsheet and press the F9 key. This will generate an entire new sample in Column A and you can repeat the procedure. The only disadvantage of this method is that the graphs produced use white lines on a black background. The second method is a bit more cumbersome and does not provide a summary chart, but yields graphs that are better for reproduction and Copyright ยฉ 2020 Pearson Education, Inc. 98 Chapter 2 that can be edited. Generate the data in the same way as was done above. In cells B1 to B10 enter the integers 0 to 9. These cells are called the BIN. Now click on Tools, Data Analysis, Histogram. (If Data Analysis is not in the Tools menu, you will have to add it from the original CD.) Click on the Input box and highlight cells A2A51 with the mouse, then click on the Bin box and highlight cells B1B10. Finally click on the Output box and enter C1. This will give you a frequency table in columns C and D. Now enter the integers 0 to 9 as text in cells E2 to E11 by entering each digit preceded by a single quote mark, i.e., โ€˜0, โ€˜1, etc. In cell F2, enter =D2, and copy this cell into F3 through F11. Now highlight the data in columns E and F with the mouse and click the chart icon, pick the Column graph type, pick the first sub-type, click on the Next button twice, enter any titles desired, remove the legend, and then click on the Next button and then the Finish button. The graph will appear on the spreadsheet as a bar chart with spaces between the bars. Use the mouse to point to any one of the bars and click with the right mouse button. Choose Format Data Series. Click on the Options tab and change the Gap Width to zero, and click OK. Repeat this sequence to produce additional histograms, but use different cells. [If you would like to avoid repeating most of the above steps, click near the border of the graph and copy the graph to the Clipboard, then go to Microsoft Word or other word processor, and click on Edit on the Toolbar and Paste Special. Highlight Microsoft Excel Chart Object, and click OK. The graphs can be resized in the word processor if necessary. Now go back to Excel and hit the F9 key. This will produce a completely new set of random numbers. Click on Tools, Data Analysis, Histogram, leave all the boxes as they are and click OK. Then click OK to overwrite existing data. A new table will be created and the existing histogram will be updated automatically. We used this process for the following histograms.] (d) These shapes are about what we expected. (e) The relative frequency histograms for six samples of digits of size ๏€ผ ๏€ผ Random Data 1000 were obtained using Minitab. Choose Calc Integer…, type 1000 in the Generate rows of data test box, click in the Store in column(s) text box and type C1 C2 C3 C4 C5 C6, click in the Minimum value text box and type 0, type in the Maximum value text Copyright ยฉ 2020 Pearson Education, Inc. Section 2.4 ๏€ผ 99 box and type 9 and click OK. Then choose Graph Histogram, select the Simple version and click OK, enter C1 C2 C3 C4 C5 C6 in the Graph variables text box, C2 in the Graph 2 text box un x, and so on for C3 through C6. Click on the Multiple Graphs button. Click on the On separate graphs button, and check the boxes for Same Y and Same X, including same bins. Click OK and click OK. The following graphs resulted. 100 100 80 80 60 60 40 40 20 20 0 0 2 4 Histogram of C3 6 0 8 C1 120 100 100 80 80 60 40 20 20 0 0 2 4 2 4 of C4 Histogram 6 8 4 6 8 6 8 C2 60 40 0 0 120 Frequency Frequency Histogram of C2 120 Frequency Frequency Histogram of C1 120 6 8 0 2 C4 C3 Histogram of C6 120 100 100 80 80 Frequency Frequency Histogram of C5 120 60 60 40 40 20 20 0 0 2 4 6 8 0 0 2 C5 4 C6 The histograms for samples of size 1000 are much closer to the rectangular distribution we expected than are the ones for samples of size 50. Copyright ยฉ 2020 Pearson Education, Inc. Review Problems 2.161 (a) 100 Your result will differ from, but be similar to, the one below which ๏€ผ ๏€ผ Random Data Normal…, was obtained using Minitab. Choose Calc type 3000 in the Generate rows of data text box, click in the Store in column(s) text box and type C1, and click OK. (b) ๏€ผ Then choose Graph Histogram, choose the Simple version, click OK, enter C1 in the Graph variables text box, click on the Scale button and then on the Y-Scale Type tab. Check the Percent box and click OK twice. Histogram of C1 8 7 Percent 6 5 4 3 2 1 0 (c) -3 -2 -1 0 C1 1 2 3 The histogram in part (b) has the bell, unimodal and symmetric distribution. The sample of 3000 is representative of the population from which the sample was taken. Section 2.5 2.162 Graphs are sometimes constructed in ways that cause them to be misleading. 2.163 (a) A truncated graph is one for which the vertical axis starts at a value other than its natural starting point, usually zero. (b) A legitimate motivation for truncating the axis of a graph is to place the emphasis on the ups and downs of the distribution rather than on the actual height of the graph. (c) To truncate a graph and avoid the possibility of misinterpretation, one should start the axis at zero and put slashes in the axis to indicate that part of the axis is missing. 2.164 Answers will vary. 2.165 (a) A large lower portion of the graph is eliminated. When this is done, differences between district and national averages appear greater than in the original figure. (b) Even more of the graph is eliminated. Differences between district and national averages appear even greater than in part (a). (c) The truncated graphs give the misleading impression that, in 2013, the district average is much greater relative to the national average than it actually is. 2.166 (a) A break is shown in the first bar on the left to warn the reader that part of the first bar itself has been removed. (b) It was necessary to construct the graph with a broken bar to let the reader know that the first bar is actually much taller than it appears. If the true height of the first bar were presented, but without the break, the height would span most of an entire page. This Copyright ยฉ 2020 Pearson Education, Inc. Section 2.5 101 would have used up, perhaps, more room than that desired by the person reporting the graph. (c) This bar chart is potentially misleading if the reader does not pay attention to the true magnitude of the first bar relative to the other three bars. This is precisely the reason for the break in the first bar, however. It is meant to alert the reader that special treatment is to be applied to the first bar. It is actually much taller than it appears. Supplying the numbers for each bar of the graph makes it clear that there was no intention to mislead the reader. This was necessary also because there is no scale on the vertical axis. 2.167 (a) The problem with the bar chart is that it is truncated. That is, the vertical axis, which should start at $0 (in trillions), starts with $7.6 (in trillions) instead. The part of the graph from $0 (in trillions) to $7.6 (in trillions) has been cut off. This truncation causes the bars to be out of correct proportion and hence creates the misleading impression that the money supply is changing more than it actually is. (b) A version of the bar chart with an untruncated and unmodified vertical axis is presented in Figure (a). Notice that the vertical axis starts at $0.00 (in trillions). Increments are in trillion dollars. In contrast to the original bar chart, this one illustrates that the changes in money supply from week to week are not that different. However, the “ups” and “downs” are not as easy to spot as in the original, truncated bar chart. (c) A version of the bar chart in which the vertical axis is modified in an acceptable manner is presented in Figure (b). Notice that the special symbol “//” is used near the base of the vertical axis to signify that the vertical axis has been modified. Thus, with this version of the bar chart, not only are the “ups” and “downs” easy to spot but the reader is also aptly warned by the slashes that part of the vertical axis between $0.00 (in trillions) and $7.6 (in trillions) has been removed. Figure (a) Figure (b) Chart of Money Supply 8 7 Money Supply 6 5 4 3 2 1 0 8/4 8/11 8/18 8/25 9/1 9/8 9/15 9/22 9/29 10/6 10/13 10/20 10/27 Date 2.168 (a) The problem with the bar chart is that it is truncated. That is, the vertical axis, which should start at 0 for both the Total Fatalities and for the Licensed Drivers starts with 10,000 and 145 respectively. This truncation causes the time-plot to be out of proportion and hence creates the misleading impression that the number of fatalities is changing more than it actually is. Copyright ยฉ 2020 Pearson Education, Inc. 102 Chapter 2 (b) The truncation was most likely used to clearly display the yearly changes in total drunk driving fatalities. Without the truncation, if the scale continued to zero, it might be hard to notice the changes from year to year. (c) An acceptable manner to modify the graph would be to use the special symbol “//” near the base of the vertical axis to signify that the vertical axis has been modified. Thus, with this modified version of the bar chart, not only are the changes in total drunk driving fatalities easy to spot but the reader is also aptly warned by the slashes that part of the vertical axis between 0 and 10,000 Total Fatalities has been removed. 2.169 (b) Without the vertical scale, it would appear that the happiness score dropped about 25% between the ages of 15 and 20. (c) The actual drop was from a happiness score of about 5.5 to a happiness score of 5.25 between the ages of 15 and 20. This is a drop of 0.25/5.5 = 0.045 or about 4.5%. (d) Without the vertical scale, it would look like the happiness scale has dropped about 50% from 5.5 to 5.0 where actually it really is closer to a 20% drop. The peak at 74 looks like a bigger significant increase without the vertical scale as well. Because the scale on the horizontal axis is not evenly spaced, the time between events is misleading. (e) The graph could be made less potentially misleading by either making the vertical scale range from zero to 6.0 and by making the scale on the vertical axis the same width. 2.170 A correct way in which the developer can illustrate the fact that twice as many homes will be built in the area this year as last year is as follows: Last Year 2.171 (a) This Year The brochure shows a “new” ball with twice the radius of the “old” ball. The intent is to give the impression that the “new” ball lasts roughly twice as long as the “old” ball. However, if the “new” ball has twice the radius of the “old” ball, the “new” ball will have eight times the volume of the “old” ball (since the volume of a sphere is proportional to the cube of its radius, or the radius 23 = 8). Thus, the scaling is improper because it gives the impression that the “new” ball lasts eight times as long as the “old” ball rather than merely two times as long. Old Ball New Ball Copyright ยฉ 2020 Pearson Education, Inc. Review Problems 103 (b) One possible way for the manufacturer to illustrate the fact that the “new” ball lasts twice as long as the “old” ball is to present pictures of two balls, side by side, each of the same magnitude as the picture of the “old” ball and to label this set of two balls “new ball”. This will illustrate the point that a purchaser will be getting twice as much for the money. Old Ball New Ball Review Problems For Chapter 2 1. 2. (a) A variable is a characteristic that varies from one person or thing to another. (b) Variables are quantitative or qualitative. (c) Quantitative variables can be discrete or continuous. (d) Data are values of a variable. (e) The data type is determined by the type of variable being observed. 3. A frequency distribution of qualitative data is a table that lists the distinct values of data and their frequencies. It is useful to organize the data and make it easier to understand. A relative-frequency distribution of qualitative data is a table that lists the distinct values of data and a ratio of the class frequency to the total number of observations, which is called the relative frequency. 4. For both quantitative and qualitative data, the frequency and relativefrequency distributions list the values of the distinct classes and their frequencies and relative frequencies. For single value grouping of quantitative data, it is the same as the distinct classes for qualitative data. For class limit and cutpoint grouping in quantitative data, we create groups that form distinct classes similar to qualitative data. 5. The two main types of graphical displays for qualitative data are the bar chart and the pie chart. 6. The bars do not abut in a bar chart because there is not any continuity between the categories. Also, this differentiates them from histograms. 7. Answers will vary. One advantage of pie charts is that it shows the proportion of each class to the total. One advantage of bar charts is that it emphasizes each individual class in relation to each other. One disadvantage of pie charts is that if there are too many classes, the chart becomes confusing. Also, if a class is really small relative to the total, it is hard to see the class in a pie chart. 8. Single value grouping is appropriate when the data are discrete with relatively few distinct observations. Copyright ยฉ 2020 Pearson Education, Inc. 104 Chapter 2 9. (a) The second class would have lower and upper limits of 9 and 14. The class mark of this class would be the average of these limits and equal 11.5. (b) The third class would have lower and upper limits of 15 and 20. (c) The fourth class would have lower and upper limits of 21 and 26. class would contain an observation of 23. (a) If the width of the class is 5, then the class limits will be four whole numbers apart. Also, the average of the two class limits is the class mark of 8. Therefore, the upper and lower class limits must be two whole numbers above and below the number 8. The lower and upper class limits of the first class are 6 and 10. (b) The second class will have lower and upper class limits of 11 and 15. Therefore, the class mark will be the average of these two limits and equal 13. (c) The third class will have lower and upper class limits of 16 and 20. (d) The fourth class has limits of 21 and 25, the fifth class has limits of 26 and 30. Therefore, the fifth class would contain an observation of 28. (a) The common class width is the distance between consecutive cutpoints, which is 15 – 5 = 10. (b) The midpoint of the second class is halfway between the cutpoints 15 and 25, and is therefore 20. (c) The sequence of the lower cutpoints is 5, 15, 25, 35, 45, … Therefore, the lower and upper cutpoints of the third class are 25 and 35. (d) Since the third class has lower and upper cutpoints of 25 and 35, an observation of 32.4 would belong to this class. (a) The midpoint is halfway between the cutpoints. is 8, 10 is halfway between 6 and 14. (b) The class width is also the distance between consecutive midpoints. Therefore, the second midpoint is at 10 + 8 = 18. (c) The sequence of cutpoints is 6, 14, 22, 30, 38, … Therefore the lower and upper cutpoints of the third class are 22 and 30. (d) An observation of 22 would go into the third class since that class contains data greater than or equal to 22 and strictly less than 30. (a) If lower class limits are used to label the horizontal axis, the bars are placed between the lower class limit of one class and the lower class limit of the next class. (b) If lower cutpoints are used to label the horizontal axis, the bars are placed between the lower cutpoint of one class and the lower cutpoint of the next class. (c) If class marks are used to label the horizontal axis, the bars are placed directly above and centered over the class mark for that class. (d) If midpoints are used to label the horizontal axis, the bars are placed directly above and centered over the midpoint for that class. 10. 11. 12. 13. Copyright ยฉ 2020 Pearson Education, Inc. This Since the class width Review Problems 14.(a)Bell-shaped (b)Triangular (c) Reverse J shape 105 (d)Uniform 15. Answers will vary but here is one possibility. 16. (a) The distribution of the large simple random sample will reflect the distribution of the population, so it would be left-skewed as well. (b) No. The randomness in the samples will almost certainly produce different sets of observations resulting in shapes that are not identical. (c) Yes. We would expect both of the simple random samples to reflect the shape of the population and be left-skewed. (a) The first column ranks the hydroelectric plants. quantitative, discrete data. (b) The fourth column provides measurements of capacity. consists of quantitative, continuous data. Thus, it (c) The third column provides nonnumerical information. of qualitative data. Thus, it consists (a) A single value frequency histogram for the prices of DVD players would be identical to the dotplot in example 2.16 because the classes would be 197 through 224 and the height for each bar in the frequency histogram would reflect the number of dots above each observation in the dotplot. (b) No. The frequency histogram with cutpoint or class limit grouping would combine some of the single values together which would change the frequencies and the heights of the bars corresponding to those classes. (a) The first class to construct is 40-44. Since all classes are to be of equal width, and the second class begins with 45, we know that the width of all classes is 45 – 40 = 5. All of the classes are presented in column 1 of the grouped-data table in the figure below. The last class to construct does not go beyond 65-69, since the largest single data value is 69. The sum of the relative frequency column is 0.999 due to rounding. 17. 18. 19. Copyright ยฉ 2020 Pearson Education, Inc. Thus, it consists of 106 Chapter 2 Age at Inauguration Frequency Relative Frequency Class Mark 40-44 2 0.045 42 45-49 7 0.159 47 50-54 13 0.295 52 55-59 12 0.273 57 60-64 7 0.159 62 65-69 3 0.068 67 44 0.999 (b) By averaging the lower and upper limits for each class, we arrive at the class mark for each class. The class marks for all classes are presented in column 4. (c) Having established the classes, we tally the ages into their respective classes. These results are presented in column 2, which lists the frequencies. Dividing each frequency by the total number of observations, which is 44, results in each class’s relative frequency. The relative frequencies for all classes are presented in column 3. (d) The frequency histogram presented below is constructed using the frequency distribution presented above; i.e., columns 1 and 2. Notice that the lower cutpoints of column 1 are used to label the horizontal axis of the frequency histogram. Suitable candidates for verticalaxis units in the frequency histogram are the even integers within the range 2 through 14, since these are representative of the magnitude and spread of the frequencies presented in column 2. The height of each bar in the frequency histogram matches the respective frequency in column 2. Histogram of AGE 14 12 Frequency 10 8 6 4 2 0 40 45 50 55 AGE 60 65 70 (e) The shape of the inauguration ages is unimodal and symmetric. 20. The horizontal axis of this dotplot displays a range of possible ages for the 44 Presidents of the United States. To complete the dotplot, we go through the data set and record each age by placing a dot over the appropriate value on the horizontal axis. Copyright ยฉ 2020 Pearson Education, Inc. Review Problems 107 Age at Inauguration for first 44 Presidents 44 21. (a) 52 56 AGE 60 64 68 Using one line per stem in constructing the ordered stem-and-leaf diagram means vertically listing the numbers comprising the stems once. The leaves are then placed with their respective stems in order. The ordered stem-and-leaf diagram using one line per stem is presented in the following figure. 4| 5| 6| (b) 48 236677899 0011112244444555566677778 0111244589 Using two lines per stem in constructing the ordered stem-and-leaf diagram means vertically listing the numbers comprising the stems twice. In turn, if the leaf is one of the digits 0 through 4, it is ordered and placed with the first of the two stem lines. If the leaf is one of the digits 5 through 9, it is ordered and placed with the second of the two stem lines. The ordered stem-and-leaf diagram using two lines per stem is presented in the following figure. 4| 4| 5| 5| 6| 6| 23 6677899 0011112244444 555566677778 0111244 589 (c) The stem-and-leaf diagram in part (b) corresponds to the frequency distribution of Problem 19. 22. (a) Using one line per stem in constructing the ordered stem-and-leaf diagram means vertically listing the numbers comprising the stems once. The leaves are then placed with their respective stems in order. The ordered stem-and-leaf diagram using one line per stem is presented in the following figure. 3| 4| 5| 6| (b) 4778 0467 446677778 0 Using two lines per stem in constructing the ordered stem-and-leaf diagram means vertically listing the numbers comprising the stems twice. In turn, if the leaf is one of the digits 0 through 4, it is ordered and placed with the first of the two stem lines. If the leaf is one of the digits 5 through 9, it is ordered and placed with the second of the two stem lines. The ordered stem-and-leaf diagram using two lines per stem is presented in the following figure. Copyright ยฉ 2020 Pearson Education, Inc. 108 Chapter 2 3| 3| 4| 4| 5| 5| 6| 23. 4 778 04 67 44 6677778 0 (c) The second graph is the most useful. Typically, we like to have five to fifteen classes and the second one provides a better idea of the shape of the distribution. (a) The frequency and relative-frequency distribution presented below is constructed using classes based on a single value. Since each data value is one of the integers 0 through 6, inclusive, the classes will be 0 through 6, inclusive. These are presented in column 1. Having established the classes, we tally the number of busy tellers into their respective classes. These results are presented in column 2, which lists the frequencies. Dividing each frequency by the total number of observations, which is 25, results in each class’s relative frequency. The relative frequencies for all classes are presented in column 3. Number Busy 0 1 2 3 4 5 6 (b) Frequency 1 2 2 4 5 7 4 25 Relative Frequency 0.04 0.08 0.08 0.16 0.20 0.28 0.16 1.00 The following relative-frequency histogram is constructed using the relative-frequency distribution presented in part (a); i.e., columns 1 and 3. Column 1 demonstrates that the data are grouped using classes based on a single value. These single values in column 1 are used to label the horizontal axis of the relative-frequency histogram. We notice that the relative frequencies presented in column 3 range in size from 0.04 to 0.28 (4% to 28%). Thus, suitable candidates for vertical axis units in the relative-frequency histogram are increments of 0.05, starting with zero and ending at 0.30. The middle of each histogram bar is placed directly over the single numerical value represented by the class. Also, the height of each bar in the relative-frequency histogram matches the respective relative frequency in column 3. Copyright ยฉ 2020 Pearson Education, Inc. Review Problems 109 0.30 0.25 0.20 0.15 0.10 0.05 0.00 0 1 2 3 Tellers 4 5 5 6 6 (c) The distribution is unimodal. (d) The distribution is left skewed. (e) Dotplot of TELLERS 0 1 2 3 TELLERS 4 (f) Since both the histogram and the dotplot are based on single value grouping, they both convey exactly the same information. 24. (a) The classes will begin with the class 60 โ€“ under 65. The second class will be 65 โ€“ under 70. The classes will continue like this until the last class, which will be 90 โ€“ under 95, since the largest observation is 93.1. The classes can be found in column 1 of the frequency distribution in part (c). (b) The midpoints of the classes are the averages of the lower and upper cutpoint for each class. For example, the first midpoint will be 62.5, the second midpoint will be 67.5. The midpoints will continue like this until the last midpoint, which will be 92.5. The midpoints can be found in column 4 of the frequency distribution in part (c). (c) The first and second columns of the following table provide the frequency distribution. The first and third columns of the following table provide the relative-frequency distribution for percentages of on-time arrivals for the airlines. Copyright ยฉ 2020 Pearson Education, Inc. 110 Chapter 2 Percent On-Time Frequency Relative Frequency Midpoint 60 โ€“ under 65 65 โ€“ under 70 70 โ€“ under 75 75 โ€“ under 80 80 โ€“ under 85 85 โ€“ under 90 90 โ€“ under 95 1 0.0625 62.5 5 0.3125 67.5 5 0.3125 72.5 3 0.1875 77.5 0 0.0000 82.5 1 0.0625 87.5 1 0.0625 92.5 16 1.0000 (d) The frequency histogram is constructed using columns 1 and 2 from the frequency distribution from part (c). The cutpoints are used to label the horizontal axis. The vertical axis is labeled with the frequencies that range from 0 to 5. 5 Frequency 4 3 2 1 0 60 65 70 75 80 85 90 95 PERCENTAGE (e) After rounding each observation to the nearest whole number, the stemand-leaf diagram with two lines per stem for the rounded percentages is 6| 6| 7| 7| 8| 8| 9| 2 669 0011334 678 8 3 (f) After obtaining the greatest integer in each observation, the stem-andleaf diagram with two lines per stem is 6| 1 6| 56999 7| 01233 7| 677 8| 8| 7 9| 3 (g) The stem-and-leaf diagram in part (f) corresponds to the frequency distribution in part (d) because the observations werenโ€™t rounded in constructing the frequency distribution. 25. (a) The dotplot of the ages of the oldest player on each major league baseball team is Copyright ยฉ 2020 Pearson Education, Inc. Review Problems 111 Dotplot of AGES 34 36 38 40 AGES 42 44 46 (b) The overall shape of the distribution of ages is bimodal and roughly symmetric. 26. (a) The classes are the types of evidence and are presented in column 1. The frequency distribution of the champions is presented in column 2. Dividing each frequency by the total number of submissions, which is 3436, results in each class’s relative frequency. The relative frequency distribution is presented in column 3. Evidence Frequency Relative Frequency Type Firearm 289 0.084 Magazine 161 0.047 Live Cartridge 2727 0.794 Spent Cartridge 259 0.075 3436 1.000 (b) We multiply each of the relative frequencies by 360 degrees to obtain the portion of the pie represented by each evidence type. The result is Pie Chart of EVIDENCE TYPE Spent cartridge casing 7.5% Firearm 8.4% Magazine 4.7% Category Firearm Magazine Live cartridge Spent cartridge casing Live cartridge 79.4% (c) We use the bar chart to show the relative frequency with which each EVIDENCE TYPE occurs. The result is Copyright ยฉ 2020 Pearson Education, Inc. 112 Chapter 2 Evidence Type 80 Percent of FREQUENCY 70 60 50 40 30 20 10 0 Firearm Magazine Live cartridge Spent cartridge casing EVIDENCE Percent within all data. (d) The most common type of evidence type submitted to crime labs is a live cartridge which was the type submitted 79.4% of the time. 27. (a) The population consists of the states in the United States. variable is the division. The (b) The frequency and relative frequency distribution for Region is shown below. Region Frequency Relative Frequency East North Central 5 0.10 East South Central 4 0.08 Middle Atlantic 3 0.06 Mountain 8 0.16 New England 6 0.12 Pacific 5 0.10 South Atlantic 8 0.16 West North Central 7 0.14 West South Central 4 0.08 50 1.000 (c) The pie chart for Region is shown below. Pie Chart of DIVISION W SC 8.0% MA C 6.0% C ategory MTN SA C W NC NED ENC PA C ESC W SC MA C MTN 16.0% ESC 8.0% SA C 16.0% PA C 10.0% ENC 10.0% WNC 14.0% NED 12.0% Copyright ยฉ 2020 Pearson Education, Inc. Review Problems (d) 113 The bar chart for Region is shown below. Chart of DIVISION 18 16 14 Percent 12 10 8 6 4 2 0 MTN SAC WNC NED ENC PAC DIVISION ESC WSC MAC Percent within all data. (e) 28. 29. 30. (a) The distribution of Region seems to be almost uniformly distributed between the categories. The smallest region is the Middle Atlantic at a frequency of 3, the largest region is the Mountain and South Atlantic at a frequency of 8. The break in the third bar is to emphasize that the bar as shown is not as tall as it should be. (b) The bar for the space available in coal mines is at a height of about 30 billion tonnes. To accurately represent the space available in saline aquifers (10,000 billion tonnes), the third bar would have to be over 300 times as high as the first bar and more than 10 times as high as the second bar. If the first two bars were kept at the sizes shown, there wouldnโ€™t be enough room on the page for the third bar to be shown at its correct height. If a reasonable height were chosen for the third bar, the first bar wouldnโ€™t be visible. The only apparent solution is to present the third bar as a broken bar. (a) Covering up the numbers on the vertical axis totally obscures the percentages. (b) Having followed the directions in part (a), we might conclude that the percentage of women in the labor force for 2000 is about three and one-half times that for 1960. (c) Not covering up the vertical axis, we find that the percentage of women in the labor force for 2000 is about 1.8 times that for 1960. (d) The graph is potentially misleading because it is truncated. that vertical axis units begin at 30 rather than at zero. (e) To make the graph less potentially misleading, we can start it at zero instead of 30. Notice (a) Using Minitab, retrieve the data from the WeissStats Resource Site. Column 2 contains the eye color and column 3 contains the hair color ๏€ผ ๏€ผ for the students. From the tool bar, select Stat Tables Tally Individual Variables, double-click on EYES and HAIR in the first box so that both EYES and HAIR appear in the Variables box, put a check mark next to Counts and Percents under Display, and click OK. The results are EYES Count Percent Blue 215 36.32 Brown 220 37.16 Green 64 10.81 Hazel 93 15.71 N= 592 HAIR Count Percent Black 108 18.24 Blonde 127 21.45 Brown 286 48.31 Red 71 11.99 N= 592 Copyright ยฉ 2020 Pearson Education, Inc. 114 Chapter 2 ๏€ผ Using Minitab, select Graph Pie Chart, check Chart counts of unique values, double-click on EYES and HAIR in the first box so that EYES and HAIR appear in the Categorical Variables box. Click Pie Options, check decreasing volume, click OK. Click Multiple Graphs, check On the Same Graphs, Click OK. Click Labels, click Slice Labels, check Category Name, Percent, and Draw a line from label to slice, Click OK twice. The results are (b) Pie Chart of EYES, HAIR EYES HAIR Green 10.8% Category Brown Blue Hazel Green Black Blonde Red Red 12.0% Brown 37.2% Hazel 15.7% Black 18.2% Brown 48.3% Blonde 21.5% Blue 36.3% ๏€ผ (c) Using Minitab, select Graph Bar Chart, select Counts of unique values, select Simple option, click OK. Double-click on EYES and HAIR in the first box so that EYES and HAIR appear in the Categorical Variables box. Select Chart Options, check decreasing Y, check show Y as a percent, click OK. Click OK twice. The results are Chart of HAIR Chart of EYES 50 40 40 Percent Percent 30 20 10 0 30 20 10 Brown Blue Hazel Green 0 Brown Black Red Percent within all data. Percent within all data. 31. Blonde HAIR EYES (a) The population consists of the states of the U.S. and the variable under consideration is the value of the exports of each state. (b) Using Minitab, we enter the data from the WeissStats Resource Site, ๏€ผ choose Graph Histogram, click on Simple and click OK. Then double click on VALUE to enter it in the Graph variables box and click OK. The result is Copyright ยฉ 2020 Pearson Education, Inc. Review Problems 115 Histogram of VALUE 25 Frequency 20 15 10 5 0 0 2000 4000 VALUE 6000 8000 ๏€ผ Dotplot, click on Simple from the (c) For the dotplot, we choose Graph One Y row and click OK. Then double click on VALUE to enter it in the Graph variables box and click OK. The result is Dotplot of VALUE 0 1200 2400 3600 4800 VALUE 6000 7200 8400 ๏€ผ Stem-and-Leaf, double (d) For the stem-and-leaf plot, we choose Graph click on VALUE to enter it in the Graph variables box and click OK. The result is Stem-and-leaf of VALUE Leaf Unit = 100 23 (10) 17 11 7 7 5 2 1 1 1 1 1 1 1 1 1 0 0 1 1 2 2 3 3 4 4 5 5 6 6 7 7 8 N = 50 00000000001112222344444 5677888899 012224 5679 69 034 6 2 (e) The overall shape of the distribution is unimodal and not symmetric. (f) The distribution is right skewed. Copyright ยฉ 2020 Pearson Education, Inc. 116 Chapter 2 32. (a) The population consists of countries of the world, and the variable under consideration is the expected life in years for people in those countries. (b) Using Minitab, we enter the data from the WeissStats Resource Site, ๏€ผ choose Graph Histogram, click on Simple and click OK. Then double click on YEARS to enter it in the Graph variables box and click OK. The result is Histogram of YEARS 30 25 Frequency 20 15 10 5 0 54 60 66 72 78 84 90 YEARS ๏€ผ Dotplot, click on Simple from the (c) For the dotplot, we choose Graph One Y row and click OK. Then double click on YEARS to enter it in the Graph variables box and click OK. The result is Dotplot of YEARS 48 54 60 66 72 78 84 90 YEARS ๏€ผ (d) For the stem-and-leaf plot, we choose Graph Stem-and-Leaf, double click on YEARS to enter it in the Graph variables box and click OK. The result is Stem-and-leaf of YEARS Leaf Unit = 1.0 3 21 30 50 73 (51) 99 33 1 4 5 5 6 6 7 7 8 8 N = 223 999 000112222223344444 556677899 00001112233333333444 55556666677788888999999 000111111111112222222223333333333344444444444444444 555555555555566666666666666667777777777788888888888889999999999999 00000000000011111111111122223444 9 (e) The overall shape of the distribution is unimodal and not symmetric. (f) This distribution is classified as left skewed. Copyright ยฉ 2020 Pearson Education, Inc. Review Problems (a) The population consists of cities in the U.S., and the variables under consideration are their annual average maximum and minimum temperatures. (b) Using Minitab, we enter the data from the WeissStats Resource Site, ๏€ผ choose Graph Histogram, click on Simple and click OK. Double click on HIGH to enter it in the Graph variables box, and double click on LOW to enter it in the Graph variables box. Now click on the Multiple graphs button and click to Show Graph Variables on separate graphs and also check both boxes under Same Scales for Graphs, and click OK twice. The result is Histogram of HIGH Histogram of LOW 25 25 20 20 15 15 Frequency Frequency 33. 117 10 5 0 10 5 36 48 60 HIGH 72 0 84 36 48 60 72 LOW ๏€ผ (c) For the dotplot, we choose Graph Dotplot, click on Simple from the Multiple Yโ€™s row and click OK. Then double click on HIGH and then LOW to enter them in the Graph variables box and click OK. The result is Dotplot of HIGH, LOW HIGH LOW 32 40 48 56 Data 64 72 80 ๏€ผ (d) For the stem-and-leaf diagram, we choose Graph Stem-and-Leaf, double click on HIGH and then on LOW to enter then in the Graph variables box and click OK. The result is Stem-and-leaf of HIGH N = 71 Leaf Unit = 1.0 3 4 789 6 5 444 21 5 555677777888999 (17) 6 00001122222333444 33 6 55556677779 22 7 00001122234 11 7 5577889 4 8 444 1 8 5 Copyright ยฉ 2020 Pearson Education, Inc. 84 118 Chapter 2 Stem-and-leaf of LOW Leaf Unit = 1.0 1 7 19 (20) 32 19 11 4 3 2 2 3 3 4 4 5 5 6 6 7 N = 71 9 001234 555556779999 00011111223333344444 5567777888899 11122223 5667889 1 9 04 (e) Both variables have distributions that are unimodal. symmetric and LOW is not symmetric. (f) LOW is slightly right skewed. Using the FOCUS Database: HIGH is close to Chapter 2 We use the Menu commands in Minitab to complete parts (a)-(e). The data sets in the Focus database and their names have already been stored in the file FOCUS.MTW on the WeissStats Resource Site supplied with the text. (a) UWEC is a school that attracts good students. HSP reflects pre-college experience and will tend to be left-skewed since fewer students with lower high school percentile scores will have been admitted, but exceptions are made for older students whose high school experience is no longer relevant. GPA will probably show left skewness tendencies since many, but not all, students with lower cumulative GPAs (below 2.0 on a 4-point scale) will likely have been suspended and will not appear in the database, but there are also upper limits on these scores, so the scores will tend to bunch up nearer to the high end than to the low end. AGE will be right skewed because there are few students below the typical 17-22 ages, but many above that range. ENGLISH, MATH, and COMP will be closer to bell-shaped. The ACT typically is taken only by high school students intending to go to college, and the scores are designed to roughly follow a bell-shaped curve. Individual colleges may, however, have a different profile that reflects their admission policies. (b) Using Minitab with FocusSample, choose Graph Histogram…, select the Simple version, and Click OK. Then specify HSP GPA AGE ENGLISH MATH COMP in the Graph variables text box and click on the button for Multiple Graphs. Click on the button for On separate graphs and click OK twice. The results are ๏€ผ Copyright ยฉ 2020 Pearson Education, Inc. Using the Focus Database Histogram of AGE Histogram of ENGLISH 40 50 30 Frequency Frequency 40 30 20 20 10 10 0 119 18 21 24 27 AGE 30 0 33 12 16 Histogram of GPA 20 24 ENGLISH 28 32 36 Histogram of HSP 30 25 25 20 Frequency Frequency 20 15 15 10 10 5 5 0 1.80 2.25 2.70 GPA 3.15 3.60 0 4.05 30 45 Histogram of MATH 60 HSP 75 90 Histogram of COMP 25 30 25 20 Frequency Frequency 20 15 10 15 10 5 0 5 15 18 21 24 MATH 27 30 33 0 18 20 22 24 COMP 26 28 30 32 The graphs compare quite well with the educated guesses for all six variables. ๏€ผ Histogram…, select the (d) Using Minitab with Focus, choose Graph Simple version, and Click OK. Then specify HSP GPA AGE ENGLISH MATH COMP in the Graph variables text box and click on the button for Multiple Graphs. Click on the button for On separate graphs and click OK twice. The results are Copyright ยฉ 2020 Pearson Education, Inc. 120 Chapter 2 Histogram of HSP Histogram of GPA 350 300 300 250 200 Frequency Frequency 250 200 150 100 100 50 50 0 150 14 28 42 56 70 84 0 98 0.90 1.35 1.80 2.25 GPA HSP Histogram of AGE 2.70 3.15 3.60 4.05 28 32 36 Histogram of ENGLISH 1800 700 1600 600 1400 500 Frequency Frequency 1200 1000 800 600 400 300 200 400 100 200 0 20 24 28 AGE 32 36 0 40 8 12 16 Histogram of MATH 20 24 ENGLISH Histogram of COMP 700 900 800 600 700 600 Frequency Frequency 500 400 300 500 400 300 200 200 100 0 100 15 18 21 24 MATH 27 30 33 36 0 15 18 21 24 COMP 27 30 33 We were correct on the first five variables: HSP and GPA are left skewed, AGE is right skewed, ENGLISH and MATH are fairly symmetric. COMP is close to symmetric, but is slightly right skewed. Comparing the graphs for the sample with those for the entire population, we see similarities between each pair of graphs, but the outline of the histogram for the entire population is much smoother than that of the histogram for the sample. (d) ๏€ผ Piechart, click on Using Minitab and the FocusSample file, choose Graph the Chart raw data button, specify SEX CLASS RESIDENCY TYPE in the Graph variables text box and click on the Labels button. Now click on the tab for Copyright ยฉ 2020 Pearson Education, Inc. Using the Focus Database 121 Slice Labels, check all four boxes and click OK, click on the button for Multiple Graphs and ensure that the button for On the same graph is checked, and click OK twice. Once the graphs are displayed, we right clicked on the legend that was shown and selected Delete since we already had provided for each slice of the graphs to be labeled. Pie Chart of SEX, CLASS, RESIDENCY, TYPE SEX CLASS Freshman 25, 12.5% Sophomore 59, 29.5% M 82, 41.0% Junior 53, 26.5% F 118, 59.0% Senior 63, 31.5% RESIDENCY Nonresident 46, 23.0% Transfer TYPE 22, 11.0% Readmit 2, 1.0% Resident 154, 77.0% New 176, 88.0% From the graph of SEX, we see that about 59% of the students are females. From the graph of CLASS, we see that the student sample is about 12.5% Freshmen, 29.5% Sophomores, 26.5% Juniors, and 31.5% Seniors. From the graph of RESIDENCY, we see that about 77% of the students are Wisconsin residents and 23$ are nonresidents. From the graph of TYPE, we see that 88.0% of the students were admitted initially as new students, 11.0% were admitted initially as transfer students, and 1.0% are readmits, that is, students who were initially new or transfer students, left the university, and were later readmitted. (e) Now repeat part (d) using the entire Focus file. The results are Pie Chart of SEX, CLASS, RESIDENCY, TYPE SEX CLASS Freshman 12.8% Sophomore 29.8% M 39.3% Junior 24.1% F 60.7% Senior 33.3% Other 0.0% Resident 76.1% RESIDENCY Nonresident 23.9% Transfer TYPE 11.1% Readmit 0.4% New 88.5% From the graph of SEX, we see that about 61% of the students are females. From the graph of CLASS, we see that the student population is about 13% Freshmen, 30% Sophomores, 24% Juniors, and 33% Seniors. From the graph of RESIDENCY, we see that about 76% of the students are Wisconsin residents and 24$ are nonresidents. From the graph of TYPE, we see that 85.5% of the Copyright ยฉ 2020 Pearson Education, Inc. 122 Chapter 2 students were admitted initially as new students, 11.1% were admitted initially as transfer students, and 0.4% are readmits, that is, students who were initially new or transfer students, left the university, and were later readmitted. We would expect that the two sets of graphs would be approximately the same, but not identical since the sample contains only 200 students out of a population of 6738. This is, in fact, the case. The percentages in each sample graph are very close to the percentages in the corresponding population graph. Case Study: Worldโ€™s Richest People (a) The first column variable is Rank and is quantitative discrete. The second column variable is Name and is qualitative. The third column variable is age and it is quantitative continuous. The fourth column variable is Citizenship and is qualitative. The fifth column variable is Wealth and is quantitative discrete since money involves discrete units, such as dollars and cents. Although, for all practical purposes, Wealth might be considered quantitative continuous data. (b) The classes are the countries of citizenship and are presented in column 1. The frequency distribution of the champions is presented in column 2. Dividing each frequency by the total number of observations, which is 25, results in each class’s relative frequency. The relative frequency distribution is presented in column 3. Country (c) Frequency Relative Frequency Canada 1 0.04 France 2 0.08 Germany 1 0.04 Hong Kong 2 0.08 India 1 0.04 Italy 1 0.04 Mexico 1 0.04 Spain 1 0.04 Sweden 1 0.04 United States 14 0.56 25 1.00 We multiply each of the relative frequencies by 360 degrees to obtain the portion of the pie represented by each team. The result is Pie Chart of CITIZENSHIP Canada 4.0% France 8.0% Germany 4.0% Hong Kong 8.0% Category Canada France Germany Hong Kong India Italy Mexico Spain Sweden United States India 4.0% United States 56.0% Italy 4.0% Mexico 4.0% Spain 4.0% Sweden 4.0% Copyright ยฉ 2020 Pearson Education, Inc. Case Study 123 The United States is the most frequent country of citizenship amongst the worldโ€™s richest. Otherwise, citizenship country seems to be randomly distributed. (d) We use the bar chart to show the relative frequency with which each COUNTRY occurs. The result is Chart of CITIZENSHIP 14 12 Count 10 8 6 4 2 0 d na Ca a Fr ce an y an m er G H g on Ko ng a di In ly Ita o ic ex M a Sp in ed Sw en U d te ni es at St CITIZENSHIP The United States is the most frequent country of citizenship amongst the worldโ€™s richest. Otherwise, citizenship country seems to be randomly distributed. (e) The first class to construct is “30 โ€“ 39โ€. All of these classes are presented in column 1. The last class to construct is “90-99โ€, since the largest data value is 93. Having established the classes, we tally the ages into their respective classes. These results are presented in column 2, which lists the frequencies. Dividing each frequency by the total number of observations, which is 25, results in the relative frequencies for each class which are presented in column 3. (f) Age Frequency Relative Frequency 30 โ€“ 39 1 0.04 40 โ€“ 49 2 0.08 50 โ€“ 59 4 0.16 60 โ€“ 69 6 0.24 70 โ€“ 79 6 0.24 80 โ€“ 89 4 0.16 90 โ€“ 99 2 0.08 25 1.00 The frequency and relative-frequency histograms for age are constructed using the frequency and relative-frequency distribution presented in part (e); i.e. The lower class limits of column 1 are used to label the horizontal axis of the histograms. The heights of each bar in the frequency histogram in Figure (a) matches the respective frequency in column 2. The heights of each bar in the relative-frequency histogram in Figure (b) matches the respective relative-frequencies in column 3. Copyright ยฉ 2020 Pearson Education, Inc. 124 Chapter 2 Figure (a) Figure (b) Histogram of AGE Histogram of AGE 25 6 20 4 Percent Frequency 5 3 15 10 2 5 1 0 30 40 50 60 70 80 90 0 1 00 30 40 50 60 70 80 90 1 00 AGE AGE (g) The shape of the distribution of age in part (e) is unimodal and is roughly symmetric. (h) The stem-and-leaf diagram of age using one line per stem is 3| 9 4| 09 5| 5678 6| 345589 7| 133779 8| 2458 9| 03 The stem-and-leaf diagram of age using two lines per stem is 3| 4| 4| 5| 5| 6| 6| 7| 7| 8| 8| 9| 9 0 9 5678 34 5589 133 779 24 58 03 The stem-and-leaf diagram of age using one line per stem corresponds to the histogram in part (f). (i) The dotplot for age is Dotplot of AGE 40 48 56 64 72 80 88 AGE Copyright ยฉ 2020 Pearson Education, Inc. Case Study 125 (j) The first class to construct is “20 โ€“ under 25โ€. All of these classes are presented in column 1. The last class to construct is “70 โ€“ under 75โ€, since the largest data value is 73. Having established the classes, we tally the into their respective classes. These results are presented in column 2, which lists the frequencies. Dividing each frequency by the total number of observations, which is 25, results in the relative frequencies for each class which are presented in column 3. Frequency Relative Frequency 20 โ€“ under 25 6 0.24 25 โ€“ under 30 10 0.40 30 โ€“ under 35 4 0.16 35 โ€“ under 40 0 0.00 40 โ€“ under 45 1 0.04 45 โ€“ under 50 0 0.00 50 โ€“ under 55 1 0.04 55 โ€“ under 60 1 0.04 60 โ€“ under 65 0 0.00 65 โ€“ under 70 1 0.04 70 โ€“ under 75 1 0.04 25 1.00 Wealth ($ billions) The frequency and relative-frequency histograms for wealth are constructed using the frequency and relative-frequency distribution presented in part (j); i.e. The lower cutpoints of column 1 are used to label the horizontal axis of the histograms. The heights of each bar in the frequency histogram in Figure (a) matches the respective frequency in column 2. The heights of each bar in the relativefrequency histogram in Figure (b) matches the respective relativefrequencies in column 3. (k) Figure (a) Figure (b) Histogram of WEALTH Histogram of WEALTH 40 10 30 6 Percent Frequency 8 20 4 10 2 0 20 30 40 50 60 70 0 20 30 WEALTH (l) 40 50 60 70 WEALTH The shape of the distribution of wealth in part (e) is unimodal and is not symmetric. The distribution of wealth is right skewed. Copyright ยฉ 2020 Pearson Education, Inc. 126 Chapter 2 (m) Truncating wealth to a whole number, the stem-and-leaf diagram using two lines per stem is (n) 2| 000123 2| 5666667889 3| 0144 3| 4| 3 4| 5| 3 5| 7 6| 6| 7 7| 3 Rounding wealth to a whole number, the dotplot is Dotplot of Wealth 21 28 35 42 49 56 63 70 Wealth ($ billions) Copyright ยฉ 2020 Pearson Education, Inc.

Document Preview (106 of 1068 Pages)

User generated content is uploaded by users for the purposes of learning and should be used following SchloarOn's honor code & terms of service.
You are viewing preview pages of the document. Purchase to get full access instantly.

Shop by Category See All


Shopping Cart (0)

Your bag is empty

Don't miss out on great deals! Start shopping or Sign in to view products added.

Shop What's New Sign in