Solution Manual For Introduction to Data Analytics for Accounting, 1st Edition

Preview Extract
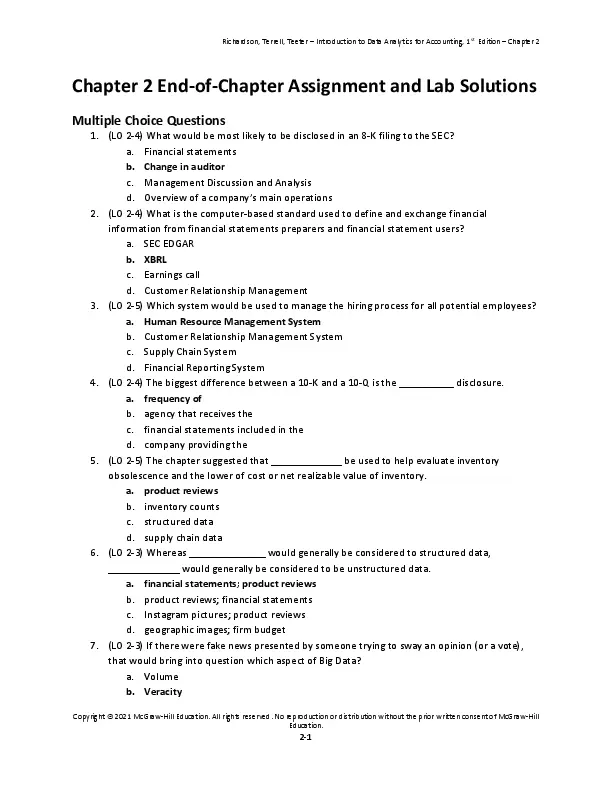
Richardson, Terrell, Teeter โ€“ Introduction to Data Analytics for Accounting, 1st Edition โ€“ Chapter 2 Chapter 2 End-of-Chapter Assignment and Lab Solutions Multiple Choice Questions 1. (LO 2-4) What would be most likely to be disclosed in an 8-K filing to the SEC? a. Financial statements b. Change in auditor c. Management Discussion and Analysis d. Overview of a companyโ€™s main operations 2. (LO 2-4) What is the computer-based standard used to define and exchange financial information from financial statements preparers and financial statement users? a. SEC EDGAR b. XBRL c. Earnings call d. Customer Relationship Management 3. (LO 2-5) Which system would be used to manage the hiring process for all potential employees? a. Human Resource Management System b. Customer Relationship Management System c. Supply Chain System d. Financial Reporting System 4. (LO 2-4) The biggest difference between a 10-K and a 10-Q is the __________ disclosure. a. frequency of b. agency that receives the c. financial statements included in the d. company providing the 5. (LO 2-5) The chapter suggested that _____________ be used to help evaluate inventory obsolescence and the lower of cost or net realizable value of inventory. a. product reviews b. inventory counts c. structured data d. supply chain data 6. (LO 2-3) Whereas ______________ would generally be considered to structured data, _____________ would generally be considered to be unstructured data. a. financial statements; product reviews b. product reviews; financial statements c. Instagram pictures; product reviews d. geographic images; firm budget 7. (LO 2-3) If there were fake news presented by someone trying to sway an opinion (or a vote), that would bring into question which aspect of Big Data? a. Volume b. Veracity Copyright ยฉ 2021 McGraw-Hill Education. All rights reserved. No reproduction or distribution without the prior written consent of McGraw-Hill Education. 2-1 Richardson, Terrell, Teeter โ€“ Introduction to Data Analytics for Accounting, 1st Edition โ€“ Chapter 2 c. Velocity d. Variety 8. (LO 2-4) An announcement of a new CEO would most likely be reported on which SEC form? a. 10-K b. 10-Q c. 8-K d. S-1 9. (LO 2-2, LO 2-5) There are really very few opportunities to have a question-and-answer session with the CEO of a company and have it recorded for others to use. However, ___________ of such an interactive question-and-answer session that is fairly widely available to all interested parties. a. management discussion and analysis as part of the 10-K b. conference call transcripts c. press releases d. SEC form 8-K 10. (LO 2-4) A business report that allows an easy, automated exchange between a financial statement repository and a financial statement user is possible using __________. a. XBRL b. XML c. excel d. Google financials Discussion Questions 1. Here are some potential items that you might be interested in knowing: a. The capacity and the tickets sold for each prior flight from New York to Miami for the last six months. b. What day of the week/what time of day are flights usually oversold? c. At what point do the airlines decide to award vouchers to customers to rebook their travel to a later time/date (i.e., how much oversold). 2. Stock prices change on a second-by-second basis for most publicly traded companies during the hours the stock exchange is open (9:30am to 4pm ET) as well as afterhours trading. Contrast that to the income statement that is only issued on a quarterly basis. Clearly stock prices have higher velocity than the income statement (or all financial statements). The income statement should have higher veracity than the stock prices as stock prices sometimes reflect more than just the value of the company and may be swayed (at least in the short-run) by (inaccurate) sentiment. It is unclear what the value of financial statements issued on a more frequent basis would be to the investors. It is good to get information on a timelier basis, but if it causes additional information overload, it may not be useful. Copyright ยฉ 2021 McGraw-Hill Education. All rights reserved. No reproduction or distribution without the prior written consent of McGraw-Hill Education. 2-2 Richardson, Terrell, Teeter โ€“ Introduction to Data Analytics for Accounting, 1st Edition โ€“ Chapter 2 3. Balance sheets and other financial statements lend themselves well to a tabular format where each number is associated with a title, or a tag. In contrast, the form and function of product reviews, in general, do not lend themselves to the same structure as the financial statements. 4. In general, financial statements are checked and rechecked and audited by both internal and external auditors and have pretty good veracity. Blogs are usually opinions that are not factchecked and thus would, in general, exhibit lower veracity. 5. A set of Instagram posts would, in general, exhibit more variety than does spreadsheet employee data. Employee data likely would have factual based information, whereas Instagram posts would include selfies, opinions, political statements, etc. 6. Form 10-K, an annual submission to the Securities and Exchange Commission, requires management discussion and analysis. It offers management an opportunity to explain prior results and forecast future goals, strategies and accounting performance. This information would be useful by data analysts to help their prediction models for future performance. Textual analysis is increasingly used to evaluate the sentiment and meaning of the data using machine learning techniques. 7. A budget would help a data analyst know what the company expected before actual performance occurred. And the actual performance would let a data analyst how well the company performed relative to those expectations. 8. Data analysts might perform textual analysis to examine the relative sentiment (good vs bad vs. average) of the management participating in the conference call. 9. A company might use its Human Resource Management system data to evaluate its employee turnover. A company might evaluate the training received by the employee, how long they were employed, if they had a college degree, their absenteeism rate, their prior performance evaluations, etc., to evaluate why they quit or kept their jobs. 10. A company could use its Customer Relationship Management data to evaluate whether a customer is continuing to order product, historical length to pay the receivables owed to the company, if the customer is still in business, etc. 11. A company could use its Supply Chain data to evaluate whether a fraudulent vendor is set up by confirming that the vendor provided product, what kind of product, etc. before deciding whether to pay the vendor. 12. Point-of-sale data could be used by a vendor to determine where (e.g., location), when (date, or time of day), to whom (which customer) that product was sold. This will help the supplier have the right product, in the right place, at the right time, at the right price for its customers. Copyright ยฉ 2021 McGraw-Hill Education. All rights reserved. No reproduction or distribution without the prior written consent of McGraw-Hill Education. 2-3 Richardson, Terrell, Teeter โ€“ Introduction to Data Analytics for Accounting, 1st Edition โ€“ Chapter 2 Brief Exercises 1. (LO 2-4) Match the accounting data term to the definition provided. Accounting Data Term Fixed Assets EDGAR 8-K Data analytics Definition plant (factories, office buildings, stores, etc.) and equipment (vehicles, fork lifts, computers, machinery, power tools, technical apparatus). automatically collects, validates, indexes and services as a repository for all forms submitted to the Securities and Exchange Commission a required submission to the Securities and Exchange Commission (SEC) that is used to notify investors of important events or announcements that either the SEC or shareholders might be interested in receiving. the technologies, systems, practices, methodologies, databases, statistics, and applications used to analyze diverse accounting and non-accounting data to give organizations the information they need to make sound and timely business decisions. 2. (LO2-4, LO2-5) Match the accounting and non-accounting data terms to the example of that data. Accounting Data Term Customer Relationship Management System Human Resource Management System Supply Chain System SEC EDGAR XBRL Example of Data Customer order history Employee salary history Vendor ID and address Form 8-K IBMโ€™s Accounts Receivable in 2021 3. (LO2-3) Match the data characteristic one of the Four Vโ€™s of Big Data. Data Characteristic Speed of Generation Unstructured Data Uncleaned data Sheer Size of Data Untrusted Data Semi-structured Data Rate of Analysis Big Vโ€™s of Big Data Velocity Variety Veracity Volume Veracity Variety Velocity Copyright ยฉ 2021 McGraw-Hill Education. All rights reserved. No reproduction or distribution without the prior written consent of McGraw-Hill Education. 2-4 Richardson, Terrell, Teeter โ€“ Introduction to Data Analytics for Accounting, 1st Edition โ€“ Chapter 2 4. (LO2-4, LO2-5) Match the data source to the data provided. Data Provided How many bananas sold in what location? How many days employee 313 missed work last year? CEO and CFO comments made on recent earnings performance Details on Accumulated Depreciation taken to Date for Tax Purposes Financial Statement Data Company Prediction of Future Sales Performance External Party Prediction of Future Earnings Data Source Point-of-Sale Terminal/Data Human Resource Management System Earnings Conference Call Fixed Asset Subledger SEC EDGAR or Yahoo! Finance Budget Data Financial Analyst Forecast Problems 1. Solution: Summarize monthly sales and compute the % Change from one month to the next (as shown in the chapter). โ€ข (2b) What is the August monthly sales? $476,883 โ€ข (2c) What is the December monthly sales? $464,258 โ€ข (3b) What is the percentage change in monthly sales from June to July (round to two decimal points)? -5.99% โ€ข (3c) What is the percentage change in monthly sales from November to December (round to two decimal points)? 4.31% 2. Solution: Summarize sales by month, by sales region (regions 1-4), and by both month and region. Solution: โ€ข (2b) What is the January monthly sales? $488,388 โ€ข (2c) What is the February monthly sales? $487,364 โ€ข (3b) What is the total sales for region 2? $1,277,842 โ€ข (3c) What is the total sales for region 4? $1,550,113 โ€ข (4b) What is the December sales for region 1? $94,646 โ€ข (4c) What is the April sales for region 4? $134,443 3. Solution: Go to SEC EDGAR (https://www.sec.gov/edgar/searchedgar/companysearch.html) and download the 2017 10-K (dated 02-27-2018) for IBM (Ticker Symbol) = IBM โ€ข (2) 2005 โ€ข (3a) What is the net income for 2017 in $ millions? $ 5,753 million โ€ข (3b) What is the total assets for 2017 in $ millions? 125,356 million 4. Solution: Go to Yahoo! Finance (https://finance.yahoo.com/) and search the symbol for the NASDAQ Composite (^IXIC). Click on Historical Data and find the close price between November 8, 2017 and November 7, 2018. Copyright ยฉ 2021 McGraw-Hill Education. All rights reserved. No reproduction or distribution without the prior written consent of McGraw-Hill Education. 2-5 Richardson, Terrell, Teeter โ€“ Introduction to Data Analytics for Accounting, 1st Edition โ€“ Chapter 2 โ€ข โ€ข (2) What was the adjusted close price for the NASDAQ Composite on November 8, 2017? $6,789.12 (3) What was the adjusted close price for the NASDAQ Composite on November 7, 2018? 7,570.75 Lab 2-1 Solution 1. Take a screenshot of the top 20 rows listing the total amount due by customer (from the PivotTable), and label it โ€œLab 2-1 Submission 1.jpg.โ€ 2. Take a screenshot of eBayโ€™s invoices due, and label it โ€œLab 2-1 Submission 2.jpg.โ€ Lab 2-1 Submission 1 Screenshot: Summarize the accounts receivable by customer. Show the pivot table for the first 20 lines. Copyright ยฉ 2021 McGraw-Hill Education. All rights reserved. No reproduction or distribution without the prior written consent of McGraw-Hill Education. 2-6 Richardson, Terrell, Teeter โ€“ Introduction to Data Analytics for Accounting, 1st Edition โ€“ Chapter 2 Lab 2-1 Submission 2 Screenshot: Invoices owed by eBay Lab 2-1 MC Questions 1. Which customer owes $700.04? a. SAP b. Pizza Hut c. Smirnoff d. Nokia 2. How many invoices does Siemens AG have? a. 4 b. 3 c. 2 d. 1 3. What is the amount of Porscheโ€™s oldest invoice (most days past due)? a. $1,440.03 b. $1,309.85 c. $1,461.73 d. $890.02 4. How many days late is General Electricโ€™s newest invoice (least days past due)? a. 46 b. 72 c. 102 d. 33 5. How many invoices does Zara have included in the accounts receivables? a. 2 b. 1 c. 3 d. 0 Copyright ยฉ 2021 McGraw-Hill Education. All rights reserved. No reproduction or distribution without the prior written consent of McGraw-Hill Education. 2-7 Richardson, Terrell, Teeter โ€“ Introduction to Data Analytics for Accounting, 1st Edition โ€“ Chapter 2 Lab 2-1 Alt 1. Take a screenshot of the top 20 rows listing the total amount due by customer (from the PivotTable), and label it โ€œLab 2-1 Alt Submission 1.jpg.โ€ 2. Take a screenshot of Thai Tap invoices due, and label it โ€œLab 2-1 Alt Submission 2.jpg.โ€ Lab 2-1 Alt Submission 1 Screenshot: Summarize the accounts receivable by customer. Show the pivot table for the first 20 lines. Lab 2-1 Alt Submission 2 Screenshot: Take a screenshot of Thai Tap invoices due, and label it โ€œLab 2-1 Alt Submission 2.jpg.โ€ Copyright ยฉ 2021 McGraw-Hill Education. All rights reserved. No reproduction or distribution without the prior written consent of McGraw-Hill Education. 2-8 Richardson, Terrell, Teeter โ€“ Introduction to Data Analytics for Accounting, 1st Edition โ€“ Chapter 2 Lab 2-1 Alt MC Questions 1. To get the pivot table summarizing invoice amounts by customer, the pivot table should have which specifications? a. Rows: [Customer]; ฮฃValues: [Invoice Amount] b. Rows: [Invoice Amount]; ฮฃValues: [Customer] c. Rows: [Days Late]; ฮฃValues: [Customer] d. Rows: [Customer]; ฮฃValues: [Days Late] 2. What are the total receivables due for the customer Wok Delight? a. $5,107.25 b. $7,732.45 c. $4,499.08 d. $3,958.44 3. Which customer owes $3,935.20? a. Grandmaโ€™s Greasy Spoon b. The Godfather c. Soup โ€˜r Salad d. We Fry it All 4. How many detailed invoices does Thai Tap have? a. 18 b. 17 Copyright ยฉ 2021 McGraw-Hill Education. All rights reserved. No reproduction or distribution without the prior written consent of McGraw-Hill Education. 2-9 Richardson, Terrell, Teeter โ€“ Introduction to Data Analytics for Accounting, 1st Edition โ€“ Chapter 2 c. 20 d. 21 5. What is the due date of the earliest invoice (most days past due) for Thai Tap included? a. 8/23/21 b. 8/24/21 c. 9/4/21 d. 8/21/21 Lab 2-2 Solution 1. Take a screenshot of the top 20 rows listing the total amount due by customer (from the PivotTable), and label it โ€œLab 2-2 Submission 1 Tableau.jpgโ€. 2. Take a screenshot of eBayโ€™s invoices due, and label it โ€œLab 2-2 Submission 2 Tableau.jpgโ€. Lab 2-2 Submission 1 Tableau Screenshot: Take a screenshot of the top 20 rows listing the total amount due by customer and label it โ€œLab 2-2 Submission 1 Tableau.jpgโ€. Copyright ยฉ 2021 McGraw-Hill Education. All rights reserved. No reproduction or distribution without the prior written consent of McGraw-Hill Education. 2-10 Richardson, Terrell, Teeter โ€“ Introduction to Data Analytics for Accounting, 1st Edition โ€“ Chapter 2 Lab 2-2 Submission 2 Tableau Screenshot: Take a screenshot of eBayโ€™s invoices due, and label it โ€œLab 2-2 Submission 2 Tableau.jpgโ€. Lab 2-2 Multiple Choice Questions 1. What is the grand total amount owed in past due invoices for IBM? a. 327 b. 2,148 c. 187 d. 2,425 2. How many days late is Honda Motor Companyโ€™s oldest invoice (most days past due)? a. 84 b. 121 c. 419 d. 720 3. How many invoices does Honda Motor Company have past due? a. 1 b. 2 c. 3 d. 4 4. Which customer has the highest balance past due? Copyright ยฉ 2021 McGraw-Hill Education. All rights reserved. No reproduction or distribution without the prior written consent of McGraw-Hill Education. 2-11 Richardson, Terrell, Teeter โ€“ Introduction to Data Analytics for Accounting, 1st Edition โ€“ Chapter 2 a. General Electric b. Pizza Hut c. Bucci d. Porsche 5. Which customer owes $2,452? a. Shell Oil Company b. IBM c. Google d. Beko Lab 2-2 Alt Solution Take a screenshot of the top 20 rows listing the total amount due by customer and label it โ€œLab 2-2 Alt Submission 1 Tableau.jpgโ€. 1. Take a screenshot of Thai Tapโ€™s invoices due and label it โ€œLab 2-2 Alt Submission 2 Tableau.jpgโ€. 2. Answer the multiple choice questions. Lab 2-2 Alt Submission 1 Tableau Screenshot: Take a screenshot of the rows listing the total amount due by customer and label it โ€œLab 2-2 Submission 1 Tableau.jpgโ€. Copyright ยฉ 2021 McGraw-Hill Education. All rights reserved. No reproduction or distribution without the prior written consent of McGraw-Hill Education. 2-12 Richardson, Terrell, Teeter โ€“ Introduction to Data Analytics for Accounting, 1st Edition โ€“ Chapter 2 Lab 2-2 Alt Submission 1 Tableau Screenshot: Take a screenshot of Taste of Thaiโ€™s invoices due, and label it โ€œLab 2-2 Submission 2 Tableau.jpgโ€. Lab 2-2 Alt Multiple Choice Questions 1. What is the grand total amount owed in past due invoices for Brewed Miracles? a. 1,393 b. 4,805 c. 187 d. 5,078 2. How many days late is Grandmaโ€™s Greasy Spoonโ€™s oldest invoice (most days past due)? a. 84 b. 159 c. 419 d. 720 3. How many invoices does Pita Pan have past due? a. 10 b. 18 c. 5 d. 4 Copyright ยฉ 2021 McGraw-Hill Education. All rights reserved. No reproduction or distribution without the prior written consent of McGraw-Hill Education. 2-13 Richardson, Terrell, Teeter โ€“ Introduction to Data Analytics for Accounting, 1st Edition โ€“ Chapter 2 4. Which customer has the highest balance past due? a. Planet of the Grapes b. Grandmaโ€™s Greasy Spoon c. One in a Million d. Pita Pan 5. Which customer owes $5,156? a. Tequila Taste b. Thai Tap c. The Godfather d. We Fry it All Lab 2-3 Solution Lab 2-3 Submission Screenshot: Take a screenshot of your pivot table and label it โ€œLab 2-3 Alt Submission.jpgโ€. Copyright ยฉ 2021 McGraw-Hill Education. All rights reserved. No reproduction or distribution without the prior written consent of McGraw-Hill Education. 2-14 Richardson, Terrell, Teeter โ€“ Introduction to Data Analytics for Accounting, 1st Edition โ€“ Chapter 2 Lab 2-3 Multiple Choice Questions 1. Which customer number is the most profitable with $357.70 in gross margin? a. 2047 b. 2088 c. 2072 d. 2046 2. If we wanted to know total sales by customer, what would we insert into the rows and ฮฃValues fields respectively? a. Customer #, Sum of Sales b. Invoice #, Sum of Sales c. Invoice #, Sum of Gross Margin d. Customer #, Sum of Gross Margin 3. If we wanted to know total gross margin by invoice, what would we insert into the rows and ฮฃValues fields respectively? a. Invoice #, Sum of Gross Margin b. Customer #, Sum of Gross Margin c. Customer #, Sum of Sales d. Invoice #, Sum of Sales 4. If we wanted to know which invoice had the largest total sales amount, what would we insert into the rows and ฮฃValues fields respectively? a. Invoice #, Sum of Sales b. Customer #, Sum of Sales c. Invoice #, Sum of Gross Margin d. Customer #, Sum of Gross Margin 5. If we wanted to know total quantity/pounds for each invoice, what would we insert into the rows and ฮฃValues fields respectively? a. Invoice #, Sum of Quantity (Pounds) b. Customer #, Sum of Quantity (Pounds) c. Quantity (Pounds), Sum of Invoice # d. Quantity (Pounds), Sum of Customer # Copyright ยฉ 2021 McGraw-Hill Education. All rights reserved. No reproduction or distribution without the prior written consent of McGraw-Hill Education. 2-15 Richardson, Terrell, Teeter โ€“ Introduction to Data Analytics for Accounting, 1st Edition โ€“ Chapter 2 Lab 2-3 Alt Solution Lab 2-3 Alt Submission Screenshot: Take a screenshot of your pivot table and label it โ€œLab 2-3 Submission.jpgโ€. Lab 2-3 Alt Multiple Choice Questions 1. Which customer number made the highest gross margin for Thrustmaster? a. Customer 3013 b. Customer 3083 c. Customer 3055 d. Customer 3036 2. Which customer bought the least in total sales for Thrustmaster? a. Customer 3008 b. Customer 3054 c. Customer 3090 d. Customer 3097 3. Which customer bought the most in total sales for Thrustmaster? a. Customer 3013 b. Customer 3083 Copyright ยฉ 2021 McGraw-Hill Education. All rights reserved. No reproduction or distribution without the prior written consent of McGraw-Hill Education. 2-16 Richardson, Terrell, Teeter โ€“ Introduction to Data Analytics for Accounting, 1st Edition โ€“ Chapter 2 c. Customer 3055 d. Customer 3036 4. Which invoice number had the highest gross margin for Thrustmaster? a. Invoice 8151 b. Invoice 8133 c. Invoice 8098 d. Invoice 8110 5. Which of the following invoice numbers had the lowest total sales for Thrustmaster? a. Invoice 8079 b. Invoice 8012 c. Invoice 8136 d. Invoice 8051 Lab 2-4 Solution Lab 2-4 Submission Screenshot: Take a screenshot of your chart in Tableau, and label it โ€œLab 24 Submission.jpg.โ€ Copyright ยฉ 2021 McGraw-Hill Education. All rights reserved. No reproduction or distribution without the prior written consent of McGraw-Hill Education. 2-17 Richardson, Terrell, Teeter โ€“ Introduction to Data Analytics for Accounting, 1st Edition โ€“ Chapter 2 Lab 2-4 Multiple Choice Questions 1. Which customer number is the least profitable with $4.80 gross margin? a. 2051 b. 2043 c. 2024 d. 2031 2. Which โ€œpillโ€ do you have on the Rows shelf? a. Customer # b. Gross Margin c. Sum(Gross Margin) d. Count(Customer #) 3. Which โ€œpillโ€ do you have on the Marks card? a. Customer # b. Gross Margin c. Sum(Gross Margin) d. Count(Customer #) 4. What is the gross margin of customer 2070? a. 6.6 b. 11.6 c. 44.9 d. 107.4 5. Swap Sum(Gross Margin) for Sum(Sales). What were the total sales for customer 2047? a. 948.5 b. 78.7 c. 32.9 d. 357.7 Copyright ยฉ 2021 McGraw-Hill Education. All rights reserved. No reproduction or distribution without the prior written consent of McGraw-Hill Education. 2-18 Richardson, Terrell, Teeter โ€“ Introduction to Data Analytics for Accounting, 1st Edition โ€“ Chapter 2 Lab 2-4 Alt Solution Lab 2-4 Alt Submission Screenshot: Take a screenshot of your chart in Tableau, and label it โ€œLab 2-4 Alt Submission.jpg.โ€ Copyright ยฉ 2021 McGraw-Hill Education. All rights reserved. No reproduction or distribution without the prior written consent of McGraw-Hill Education. 2-19 Richardson, Terrell, Teeter โ€“ Introduction to Data Analytics for Accounting, 1st Edition โ€“ Chapter 2 Copyright ยฉ 2021 McGraw-Hill Education. All rights reserved. No reproduction or distribution without the prior written consent of McGraw-Hill Education. 2-20 Richardson, Terrell, Teeter โ€“ Introduction to Data Analytics for Accounting, 1st Edition โ€“ Chapter 2 Lab 2-4 Alt Multiple Choice Questions 1. Which customer number is the least profitable with $15 gross margin? a. 3008 b. 3056 c. 3070 d. 3013 2. What is the gross margin of customer 3080? a. $204 b. $25 c. $137 Copyright ยฉ 2021 McGraw-Hill Education. All rights reserved. No reproduction or distribution without the prior written consent of McGraw-Hill Education. 2-21 Richardson, Terrell, Teeter โ€“ Introduction to Data Analytics for Accounting, 1st Edition โ€“ Chapter 2 d. $308 3. Swap SUM(Gross Margin) with Sum(Sales Price). What were the total sales made to customer 3008? a. $15.13 b. $34.65 c. $17.76 d. $37.91 4. Which customer had $2,543 in sales for Thrustmaster? a. 3013 b. 3049 c. 3060 d. 3008 5. Swap Customer for SKU. Which SKU had the highest sales for Thrustmaster? a. WHL-TGT b. PED-TPR c. PCG-HOW d. FLI-USB Lab 2-5 Solution Lab 2-5 Submission 1 Screenshot: Take a screenshot of the bins for your histogram and label it โ€œLab 2-5 Submission 1.jpgโ€. Lab 2-5 Submission 2 Screenshot: Take a screenshot of your detailed listing of fruit products sold from the 0.4 to 0.425 gross margin percentage range. Copyright ยฉ 2021 McGraw-Hill Education. All rights reserved. No reproduction or distribution without the prior written consent of McGraw-Hill Education. 2-22 Richardson, Terrell, Teeter โ€“ Introduction to Data Analytics for Accounting, 1st Edition โ€“ Chapter 2 Lab 2-5 Multiple Choice Questions 1. Which product has the highest gross margin percentage? a. Jambul b. Purple Mangos c. Jabuticaba d. Pear 2. How many products (SKUs) have gross margin percentages in the 0.325 โ€“ 0.35 range? a. 13 b. 24 c. 23 d. 21 3. What word do we use to describe the different groupings in a histogram? a. Bins b. Buckets c. Ranges d. Clusters 4. Which gross margin percentage bin does the FRT-COU SKU fit in? a. 0.35 – 0.375 Copyright ยฉ 2021 McGraw-Hill Education. All rights reserved. No reproduction or distribution without the prior written consent of McGraw-Hill Education. 2-23 Richardson, Terrell, Teeter โ€“ Introduction to Data Analytics for Accounting, 1st Edition โ€“ Chapter 2 b. 0.375 โ€“ 0.40 c. 0.325 โ€“ 0.35 d. 0.40 โ€“ 0.425 5. Which gross margin percentage bin does the Goji Berry product fit in? a. 0.35 – 0.375 b. 0.375 โ€“ 0.40 c. 0.325 โ€“ 0.35 d. 0.40 โ€“ 0.425 Lab 2-5 Alt Solution Lab 2-5 Alt Submission Screenshot 1: Take a screenshot of your histogram and label it โ€œLab 2-5 Alt Submission 1.jpgโ€. Lab 2-5 Alt Submission Screenshot 1: Take a screenshot of your detailed listing of fruit products sold from the 0.475 to 0.50 gross margin percentage range and label it โ€œLab 2-5 Alt Submission 2.jpgโ€. Lab 2-5 Alt Multiple Choice Questions Copyright ยฉ 2021 McGraw-Hill Education. All rights reserved. No reproduction or distribution without the prior written consent of McGraw-Hill Education. 2-24 Richardson, Terrell, Teeter โ€“ Introduction to Data Analytics for Accounting, 1st Edition โ€“ Chapter 2 1. Which SKU has the highest gross margin percentage? a. FLI-HO1 b. COM-FCS c. FLI-HOX d. PED-T3P 2. Which product description has the lowest gross margin percentage? a. T16000M FCS b. TMX Pro Racing Wheel c. T 16000M Space SIM Duo Stick d. TWCS Throttle 3. How many products are in the 0.40 to 0.425 bin? a. 7 b. 4 c. 5 d. Cannot be determined 4. Which product has the highest gross margin? a. T-GT Racing Wheel (PS4/PC) b. TPR Pedals – Windows c. T16000M FCS d. USB Joystick 5. What is the gross margin for SKU PED-T80? a. $42.41 b. $63.85 c. $196.77 d. $0.446 Lab 2-6 Solution Copyright ยฉ 2021 McGraw-Hill Education. All rights reserved. No reproduction or distribution without the prior written consent of McGraw-Hill Education. 2-25 Richardson, Terrell, Teeter โ€“ Introduction to Data Analytics for Accounting, 1st Edition โ€“ Chapter 2 Lab 2-6 Submission 1 Screenshot: Take a screenshot of your histogram, and label it โ€œLab 2-6 Submission 1 Tableau.jpgโ€. Lab 2-6 Submission 2 Screenshot: Take a screenshot of your dashboard, and label it โ€œLab 2-6 Submission 2 Tableau.jpgโ€. Copyright ยฉ 2021 McGraw-Hill Education. All rights reserved. No reproduction or distribution without the prior written consent of McGraw-Hill Education. 2-26 Richardson, Terrell, Teeter โ€“ Introduction to Data Analytics for Accounting, 1st Edition โ€“ Chapter 2 Lab 2-6 Multiple Choice Questions 1. How many SKUs are in the lowest bin? a. 10 b. 13 c. 7 d. 18 2. Which SKU has the highest gross margin percentage in the 2nd bin? a. FRT-STR Strawberry b. FRT-FII Fig c. FRT-GOR Goji Berry d. FRT-Sam Satsuma 3. What is FRT-CHR Cherryโ€™s gross margin percentage? a. 0.37714 b. 0.37600 c. 0.42000 d. 0.28910 Copyright ยฉ 2021 McGraw-Hill Education. All rights reserved. No reproduction or distribution without the prior written consent of McGraw-Hill Education. 2-27 Richardson, Terrell, Teeter โ€“ Introduction to Data Analytics for Accounting, 1st Edition โ€“ Chapter 2 4. How many SKUs are in the highest bin? a. 13 b. 21 c. 24 d. 23 5. Which bin has the fewest SKUs? a. First bin b. Second bin c. Third bin d. Fourth bin Lab 2-6 Alt Solution Lab 2-6 Alt Submission 1 Screenshot: Take a screenshot of your histogram, and label it โ€œLab 2-6 Alt Submission 1 Tableau.jpgโ€. Lab 2-6 Alt Submission 2 Screenshot: Take a screenshot of your dashboard, and label it โ€œLab 26 Alt Submission 2 Tableau.jpgโ€. Copyright ยฉ 2021 McGraw-Hill Education. All rights reserved. No reproduction or distribution without the prior written consent of McGraw-Hill Education. 2-28 Richardson, Terrell, Teeter โ€“ Introduction to Data Analytics for Accounting, 1st Edition โ€“ Chapter 2 Lab 2-6 Alt Multiple Choice Questions 1. Which SKU has the highest gross margin percentage in the third bin? a. FLI-STX b. FLI-USB c. PED-T80 d. PCG-HOW 2. What is the gross margin percentage for PCG-HOW Hotas Warthog PC? a. .44647 b. .42973 c. .42714 d. .42516 3. Which product has the highest gross margin percentage, overall? a. FLI-HO1 T-Flight Hotas One b. PED-T3A T3PA Add-On Copyright ยฉ 2021 McGraw-Hill Education. All rights reserved. No reproduction or distribution without the prior written consent of McGraw-Hill Education. 2-29 Richardson, Terrell, Teeter โ€“ Introduction to Data Analytics for Accounting, 1st Edition โ€“ Chapter 2 c. COM-FCS T17000M FCS Flight Pack d. WHL-TGT T-GT Racing Wheel 4. How many SKUs are in the lowest bin? a. 3 b. 4 c. 5 d. 6 5. Which bin has the fewest SKUs? a. First bin b. Second bin c. Third bin d. Fourth bin Copyright ยฉ 2021 McGraw-Hill Education. All rights reserved. No reproduction or distribution without the prior written consent of McGraw-Hill Education. 2-30

Document Preview (30 of 246 Pages)

User generated content is uploaded by users for the purposes of learning and should be used following SchloarOn's honor code & terms of service.
You are viewing preview pages of the document. Purchase to get full access instantly.

Shop by Category See All


Shopping Cart (0)

Your bag is empty

Don't miss out on great deals! Start shopping or Sign in to view products added.

Shop What's New Sign in