Solution Manual For Industrial Organization: Contemporary Theory and Empirical Applications, 5th Edition

Preview Extract
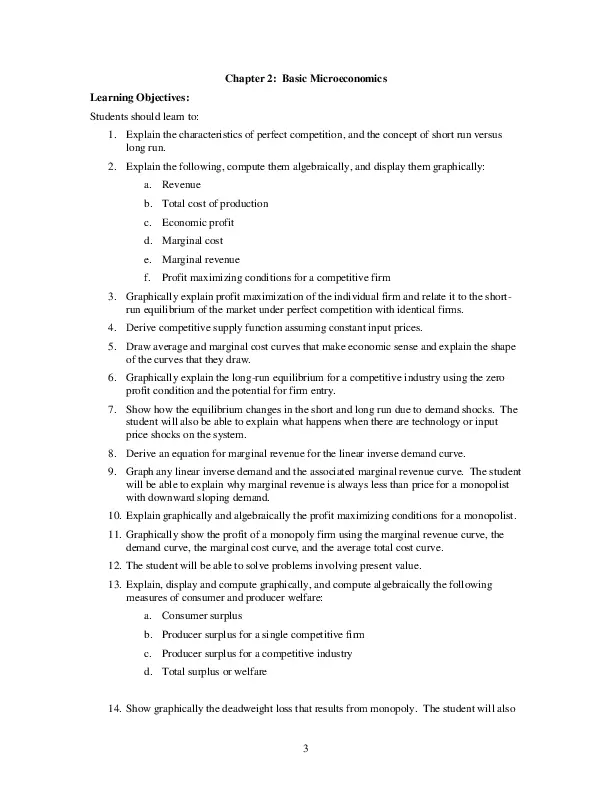
Chapter 2: Basic Microeconomics Learning Objectives: Students should learn to: 1. Explain the characteristics of perfect competition, and the concept of short run versus long run. 2. Explain the following, compute them algebraically, and display them graphically: a. Revenue b. Total cost of production c. Economic profit d. Marginal cost e. Marginal revenue f. Profit maximizing conditions for a competitive firm 3. Graphically explain profit maximization of the individual firm and relate it to the shortrun equilibrium of the market under perfect competition with identical firms. 4. Derive competitive supply function assuming constant input prices. 5. Draw average and marginal cost curves that make economic sense and explain the shape of the curves that they draw. 6. Graphically explain the long-run equilibrium for a competitive industry using the zero profit condition and the potential for firm entry. 7. Show how the equilibrium changes in the short and long run due to demand shocks. The student will also be able to explain what happens when there are technology or input price shocks on the system. 8. Derive an equation for marginal revenue for the linear inverse demand curve. 9. Graph any linear inverse demand and the associated marginal revenue curve. The student will be able to explain why marginal revenue is always less than price for a monopolist with downward sloping demand. 10. Explain graphically and algebraically the profit maximizing conditions for a monopolist. 11. Graphically show the profit of a monopoly firm using the marginal revenue curve, the demand curve, the marginal cost curve, and the average total cost curve. 12. The student will be able to solve problems involving present value. 13. Explain, display and compute graphically, and compute algebraically the following measures of consumer and producer welfare: a. Consumer surplus b. Producer surplus for a single competitive firm c. Producer surplus for a competitive industry d. Total surplus or welfare 14. Show graphically the deadweight loss that results from monopoly. The student will also 3 be able to compute this loss given parameters for demand, cost and/or supply functions. 15. Explain various relationships between the interest rate r, and the discount rate, R. 16.Explain the importance of firm size (production or sales potential) relative to market demand as it relates to monopoly power and market inefficiency. Suggested Lecture Outline: Spend three fifty-minute long lectures on this chapter. Lecture 1: 1. Brief review of consumer demand and the linear inverse demand function 2. Characteristics of perfect competition 3. Optimal choice of output 4. Individual versus market supply 5. Market equilibrium and the zero profit condition Lecture 2: a. Monopoly (market) power and downward sloping demand b. Marginal revenue for a monopolist c. Profit maximizing choice of a monopolist d. Equilibrium and positive economic profit e. Opportunity cost of financial capital f. Present value analysis and discounting g. The interest r and the discount rate R = 1/r h. Discounting for multiple time periods i. Discounting for infinite time periods j. Comparison of alternative cost and return streams Lecture 3: a. Concepts of economic surplus b. Consumer, producer, and total surplus with competition c. Computing consumer, producer and total surplus for the monopoly firm d. Efficiency comparisons of competition and monopoly using surplus concepts e. f. Present value analysis and discounting g. The interest r and the discount rate R = 1/r h. Discounting for multiple and infinite time periods i. The Coase Durable Goods Model j. Non-surplus approach to economic efficiency k. 4 Suggestions for the Instructor: 1. If the students have access to computers, a good exercise is to have them create a table (using a spreadsheet program) listing fixed cost, variable cost, total cost, average fixed cost, average variable cost, average total cost, marginal cost, price, and revenue for a given cost function. Then have students graph the various curves. 2. Give the students a couple of problems where they need to set price equal to marginal cost and solve for quantity. Do this for different cost functions. Then have them sum these to obtain an industry supply. Do this for 3 firms, each with a different upward sloping marginal cost curve and then for 20 firms, each with the same marginal cost function. Have students then invert this equation to get p as a function of aggregate Q. Then set this equal to a linear inverse demand curve to determine industry equilibrium. 3. When discussing consumer surplus the easiest way to proceed is to consider a number of consumers who will only buy one unit apiece but have different reservation prices. 4. Producer surplus is easy to motivate if one views the supply curve as the marginal cost curve with the area under it representing total variable costs of production. One can also (for those who donโ€™t understand integration) derive this area as surplus using the idea that the height of the curve represents the marginal cost to produce an item and the price represents the value received. The difference between these two heights is surplus for that unit like in the consumer case. Solutions to the End of Chapter Problems: Problem 1 (a) Setting inverse demand function equal to the inverse supply function, we obtain the equilibrium quantity We find price by substituting Q into the inverse demand or supply equation 1 (b) CS = ( 1000 โˆ’ 633.6207 )(14655.172 ) = 2684675.8 2 PS = 1 ( 633.6207 โˆ’ 150 )(14655.172 ) = 3543772.3 2 Problem 2 5 C Before forming the supply association, the industry price is given by P = MC. The quantity C supplied is Q where price is equal to marginal cost. There are no profits and consumer surplus is C M equal to the area adP . After forming the association and restricting supply, the price rises to P . M c M The quantity is Q . Producers now have profits equal to the area P cbP while consumer surplus M falls to abP . The deadweight loss is equal to the area bcd. Problem 3 (a) We set price equal to marginal cost for any one of the firms to obtain (b) Because there are 100 identical firms, we can simply multiply the supply curve in part a by 100 as follows to obtain the supply equation. We then solve this equation for P as a function of Q to get inverse supply Problem 4 (a) Find the inverse demand function by solving the demand equation for P as a function of Q 6 Then set this equal to marginal cost to find the competitive solution. This will give Under monopoly we set marginal revenue equal to marginal cost. We find marginal revenue by finding total revenue first and taking the derivative with respect to Q or by applying the same intercept – twice the slope rule to the inverse demand. Using the same intercept – twice the slope rule we obtain If we derive an equation for revenue we obtain Taking the derivative we obtain Setting this equal to marginal cost we obtain 7 (b) First compute the elasticity for the competitive case where Q = 500 and P = 10. Then compute the elasticity for the monopoly case where Q = 250 and P = 15. ๏ฅ D ( monoply ) = โˆ’ P ๏„Q 15 750 =โˆ’ ( โˆ’50 ) = =3 Q ๏„P 250 250 (c) The monopoly price is P = 15. Marginal cost for this firm is MC = 10. So we obtain P โˆ’ MC 15 โˆ’ 10 5 1 = = = P 15 15 3 ๏ฅ D = 3, 1 ๏ฅD = 1 1 = (3) 3 Problem 5 (a) To find the competitive quantity we set price equal to marginal cost and solve for Q as follows. We obtain price by substituting the competitive quantity in the inverse demand function. Or we could simply note that with P = MC, price must be equal to 1, and then substitute this in 8 the inverse demand equation and solve for Q. (b) With an inverse demand of P = 3 – Q/16,000, marginal revenue is given by MR = 3 Q/8,000. Setting this equal to marginal cost will yield the monopoly value of Q. Solving for price we obtain (c) The following diagram will be useful for this problem. The competitive industry has no profits and so producer surplus is zero. Consumer surplus is given by the triangle that starts at 1, proceeds over to c, and then angles up to 3. The base is 32,000, the height is 2, and the area is ยฝ(32,000)(2) = 32,000. W ith a monopoly consumer surplus is given by the triangle that starts at 2, proceeds over to a, and then angles up to 3. The base is 16,000, the height is 1, and the area is ยฝ(16,000)(1) = 8,000. Profits or producer surplus for the monopolist are given by the rectangle beginning at 1, proceeding over to b, up to a and then back over to 2. This rectangle has dimensions 16,000×1 = 16,000. So total surplus with monopoly is 24,000. The loss from monopoly is then 32,000 – 24,000 or 8,000. One can also compute the area of the deadweight loss triangle abc. It has base 16.,000 and height 1 for an area of 1 2 (16,000)(1) = 8,000 . Problem 6 (a) First find the inverse demand function as follows Then set marginal revenue equal to marginal cost. Find marginal revenue from total revenue first as follows 9 Setting this equal to marginal cost we obtain Profit is given by (b) First find the inverse demand function as follows Then set marginal revenue equal to marginal cost. Profit is given by (c) First find the inverse demand function as follows Then set marginal revenue equal to marginal cost. 10 Profit is given by (d) The diagram below shows demand, marginal revenue, and marginal cost for parts a-c of this question. Notice that for some values of marginal cost the firm would choose the same price but not the same quantity. And for other values of marginal cost, the firm may choose the same quantity but charge different prices. Another way to look at this is to notice that 20 is supplied with a price of $50 while at a lower price of $30, 40 units are supplied. This hardly seems like the normal notion of supply. Consider then a diagram showing price and quantity for this monopolist when the technology and marginal cost are the same. 11 As demand shifts, we do not trace out a supply curve as would happen in the competitive case. With a constant marginal cost in this problem, the supply curve for competitive firm would be horizontal and the shifting demand would simply show alternative quantities at the price of $10. 12

Document Preview (10 of 163 Pages)

User generated content is uploaded by users for the purposes of learning and should be used following SchloarOn's honor code & terms of service.
You are viewing preview pages of the document. Purchase to get full access instantly.

Shop by Category See All


Shopping Cart (0)

Your bag is empty

Don't miss out on great deals! Start shopping or Sign in to view products added.

Shop What's New Sign in