Solution Manual for Health Economics, 1st Edition

Preview Extract
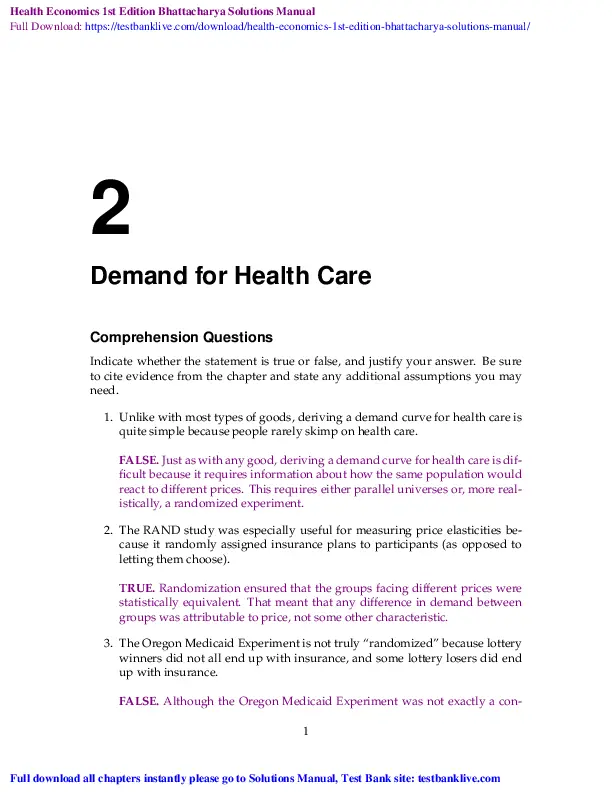
Health Economics 1st Edition Bhattacharya Solutions Manual Full Download: https://testbanklive.com/download/health-economics-1st-edition-bhattacharya-solutions-manual/ 2 Demand for Health Care Comprehension Questions Indicate whether the statement is true or false, and justify your answer. Be sure to cite evidence from the chapter and state any additional assumptions you may need. 1. Unlike with most types of goods, deriving a demand curve for health care is quite simple because people rarely skimp on health care. FALSE. Just as with any good, deriving a demand curve for health care is difficult because it requires information about how the same population would react to different prices. This requires either parallel universes or, more realistically, a randomized experiment. 2. The RAND study was especially useful for measuring price elasticities because it randomly assigned insurance plans to participants (as opposed to letting them choose). TRUE. Randomization ensured that the groups facing different prices were statistically equivalent. That meant that any difference in demand between groups was attributable to price, not some other characteristic. 3. The Oregon Medicaid Experiment is not truly โ€œrandomizedโ€ because lottery winners did not all end up with insurance, and some lottery losers did end up with insurance. FALSE. Although the Oregon Medicaid Experiment was not exactly a con1 Full download all chapters instantly please go to Solutions Manual, Test Bank site: testbanklive.com 2 | Health Economics Answer Key trolled experiment, it did use randomization to assign participants to different groups, and one group (the โ€œlottery winnersโ€) were much more likely to obtain health insurance. 4. The RAND HIE found that people assigned to the free health plan had the same rate of hospitalization as people assigned to the cost-sharing plans. FALSE. The people assigned to the free plan visited the hospital more frequently and were more likely to visit the ER. 5. In the RAND HIE, the arc elasticity of demand for inpatient care was larger (in absolute value) than the arc elasticity of demand for outpatient care. FALSE. That result would imply that people are more price sensitive when it comes to more urgent health care. Instead, the arc elasticity of demand for impatient care was smaller in absolute value. 6. Unlike the usual measure of elasticity, an arc elasticity can be calculated from just one price-quantity data point. FALSE. Any measure of elasticity requires data from at least two price levels in order to measure responsiveness to price. 7. Both the RAND and Oregon studies find that demand for health care is approximately unit elastic, that is, โ‰ˆ โˆ’1. FALSE. The RAND HIE finds that demand for health care is very inelastic, with arc elasticities around 0.2. 8. In the RAND HIE, being assigned more generous insurance did not generally improve participantsโ€™ health outcomes, except among certain subgroups. TRUE. The RAND HIE finds that generous insurance only provided small health improvements to healthy people. However, high-risk participants (like those who were smokers or had high blood pressure) did receive substantial health benefits from more generous insurance. 9. To date, no major health insurance experiment has studied the impact of uninsurance, just different levels of insurance. FALSE. The Oregon Medicaid Experiment studied the impact of uninsurance. 10. Results from the Oregon Medicaid Experiment suggest that having health insurance has a positive impact on health status. c Bhattacharya, Hyde & Tu 2013 2 Chapter 2| Demand for Health Care | 3 TRUE. Lottery winners in the Oregon Medicaid Experiment were not more likely to survive than lottery losers, but they had better self-reported physical health and mental health. 3 c Bhattacharya, Hyde & Tu 2013 4 | Health Economics Answer Key Analytical Problems 11. Suppose you are collecting data from a country like Japan where the government sets the price of health care. Each prefecture in Japan has a different set of prices (for example, Tokyo has higher prices than rural Hokkaido). Data for 1999 are displayed in Table 2.12. Table 2.12: Outpatient utilization in Tokyo and Hokkaido, 1999. Region Outpatient visits Price/visit Tokyo Hokkaido 1.25/month 1.5/month 20U 10U (a) What is the arc price elasticity of demand for health care consumers in Japan (using only these data)? We are given data on the number of doctor visits and their corresponding prices in Tokyo and Hokkaido prefectures in 1999. Let Qt1 represent the number of doctor visits and Pt1 the price of doctor visits in Tokyo in 1999. Similarly, let Qh1 and Ph1 represent the corresponding quantities for Hokkaido. The formula for calculating arc elasticities is: Pt1 + Ph1 Qt1 โˆ’ Qh1 = Pt1 โˆ’ Ph1 Qt1 + Qh1 (2.1) Plugging the numbers into this formula yields an estimate (say, 1 ) for the arc elasticity of demand for medical care in Japan: 1.25 โˆ’ 1.5 20 + 10 1 = = โˆ’0.273 (2.2) 20 โˆ’ 10 1.25 + 1.5 (b) Suppose that incomes are generally much higher in Tokyo than Hokkaido. Is your answer to the last question an overestimate or underestimate of price elasticity? Justify your answer. Demand in Tokyo is lower than in Hokkaido because of the higher price, but it is higher than it would be in Hokkaido at that higher price due to the income effect. Therefore, the arc elasticity from the previous problem is an underestimate; demand in each region will be more responsive to price than our answer suggests. See the figure below for an illustration; note that demand curves with constant arc elasticity will not be c Bhattacharya, Hyde & Tu 2013 4 Chapter 2| Demand for Health Care | 5 Response to exercise 11(b). The solid lines are the underlying demand curves in Tokyo and Hokkaido; the dotted line is the demand curve implied by the two datapoints. P Tokyo Hokkaido Q linear โ€“ this is just an illustration of the basic principle. The dotted line is steeper than the solid lines, which means the elasticity implied by the datapoints is an underestimate of the price elasticity in each region. (c) Using your estimated elasticity, what would the demand for health care be if the price in Tokyo were raised to 30 U per visit? What would the demand in Hokkaido be if the price were lowered to 5 U per visit? There are several acceptable ways to answer how the demand would change in each prefecture if the price were to change. The simplest way is to take each prefectureโ€™s 1999 levels as the base price, calculate what the percentage change in price would be off this base, and then apply the elasticity estimate to derive the estimated percentage change in quantity demanded at the new price. If the price in Tokyo were raised to 30 U, this would represent a 50% increase over the base price of 20 U. Assuming a constant elasticity of demand of โˆ’0.273 over this range of prices (a risky assumption, but thereโ€™s not much else to do here!) leads to a predicted 50% โˆ— โˆ’0.273 = 13.7% decline in demand. Since Tokyoโ€™s base demand in 1999 was 1.25 visits per month, a 13.7% decline would mean 1.08 visits per month. If the price in Hokkaido were lowered to 5 U, this would represent a 50% decrease off the base price of 10 U. Using the same methodology leads to a predicted 13.7%(= โˆ’50% โˆ— โˆ’0.273) increase in demand. Since Hokkaidoโ€™s base demand in 1999 was 1.5 visits per month, a 13.7% increase would mean 1.71 visits per month. 5 c Bhattacharya, Hyde & Tu 2013 6 | Health Economics Answer Key Table 2.13: Outpatient utilization in Tokyo and Hokkaido, 2000. Region Outpatient visits Price/visit Tokyo Hokkaido 1.0/month 1.2/month 30U 15U You continue your observations of the Japanese health care system into the year 2000. For inscrutable reasons having to do with internal Japanese politics, the government changed the price in both Tokyo and Hokkaido that year, and you observe the demand recorded in Table 2.13. (d) Calculate the price elasticity of demand for health care in Japan using only data from the year 2000. Let Qt2 represent the number of doctor visits and Pt2 the price of doctor visits in Tokyo in 2000 and let Qh2 and Ph2 represent the corresponding quantities for Hokkaido. Plugging the new data into the old formula yields a second estimate (say 2 ) for the arc elasticity of demand: 30 + 15 Pt2 + Ph2 1.0 โˆ’ 1.2 Qt2 โˆ’ Qh2 = โˆ’0.273 = 2 = Pt2 โˆ’ Ph2 Qt2 + Qh2 30 โˆ’ 15 1.0 + 1.2 (2.3) (e) Use data from both years to calculate the elasticity of demand for health care for Tokyo and Hokkaido separately. Using the data from both years, we can derive two different elasticity estimates โ€“ one for Tokyo (t ) and one for Hokkaido (h ). For Tokyo, we have: Pt2 + Pt1 1.0 โˆ’ 1.25 30 + 20 Qt2 โˆ’ Qt1 = = โˆ’0.556 t = Pt2 โˆ’ Pt1 Qt2 + Qt1 30 โˆ’ 20 1.0 + 1.25 (2.4) For Hokkaido, the elasticity estimate is: Qh2 โˆ’ Qh1 Ph2 + Ph1 1.2 โˆ’ 1.5 15 + 10 = h = = โˆ’0.556 Ph2 โˆ’ Ph1 Qh2 + Qh1 15 โˆ’ 10 1.2 + 1.5 (2.5) (f) Using your estimated elasticities, what would the demand for health care in each prefecture be if the price were raised to 60U per visit next c Bhattacharya, Hyde & Tu 2013 6 Chapter 2| Demand for Health Care | 7 year (for both prefectures)? If the price of doctor visits were raised to 60 U in 2001 in Tokyo, this would represent a 100% increase over the price of 30 U in 2000. Applying the t estimate of demand elasticity in Tokyo yields a predicted decrease in demand of 55.6%(= 100% โˆ— โˆ’0.556) from year 2000 demand levels. This yields a predicted 1.0 โˆ— 0.444 = 0.444 visits per month in 2001 in Tokyo. If the price of doctor visits were raised to 60 U in 2001 in Hokkaido, this would represent a 300% increase over the price of 15 U in 2000. Applying the h estimate of demand elasticity in Hokkaido yields a predicted decrease in demand of 166.7%(โ‰ˆ 300% โˆ— โˆ’0.556) from year 2000 demand levels. We would predict no outpatient visits at all in Hokkaido in 2001! This is of course very unlikely; this result illustrates the limitations of assuming a constant elasticity. (g) Combine the Tokyo and Hokkaido estimates from exercise 11(e) to get a single estimate of the price elasticity of health care demand for all of Japan. Assume that Tokyo is five times as populous as all of Hokkaido. To combine these elasticity estimates into a single national estimate (say 3 ), we can take a simple population weighted average of the two elasticity estimates, t and h , from the two prefectures. Let Pt be the population of Tokyo, and let Ph be the population of Hokkaido. The population average estimate is: t Pt + h Ph (2.6) 3 = Pt + Ph We are given that Pt = 5Ph , so this expression can be simplified: 3 = 5t Ph + h Ph 5t + h = 5Ph + Ph 6 (2.7) Applying this formula yields an elasticity estimate of 3 = โˆ’0.556. Since the estimated elasticities were the same in each region, it would have been easy to jump straight to this answer without doing any math. 12. Preventative care refers to care taken to prevent future diseases rather than to treat current ones. Compared to emergency room care, preventative care is rarely urgent, and benefits can be difficult to measure โ€“ if you had the flu vaccine this year but did not catch the flu, it is impossible to tell if it was the shot or assiduous hand washing that preserved you. 7 c Bhattacharya, Hyde & Tu 2013 8 | Health Economics Answer Key (a) Given this description of preventative care, would you expect preventative care to be more or less price sensitive compared to inpatient care? Why? Because preventative care often seems like optional medical care to many people (unlike urgent medical care) intuition suggests that the demand for preventative care will likely be more price sensitive than the demand for other types of care. (b) Table 2.14 shows evidence on preventative care from the RAND HIE. Summarize the data in the table and note any interesting patterns. Was your prediction correct? For men of all ages, the rates of going to the doctor for preventative care are low โ€“ between 60% and 70% do not see their doctor for preventative care at all. There does not appear to be a statistically significant effect of higher copayments on the demand for preventative care. However, for older men, the point estimates suggest (approximately) a 12 percentage point decline in the demand for preventative care when copayments are imposed. Women have a higher level of demand for preventative care than men. Imposing copayments has a modest, statistically significant, effect on the demand for preventative care (except in the case of young womensโ€™ demand for pap smears). Table 2.14: Percentage with preventative care in the last 3 years from the RAND HIE study Free Copay Males 17-44 Males 45-64 Females 17-44 Females 45-64 any care any care any care Pap test any care Pap test 27.2% 23.1% 39.1% 27.4% 83.7% 76.9%โˆ—โˆ— 72.2% 65.8% 76.9% 65.3%โˆ—โˆ— 65.0% 52.8%โˆ—โˆ— โˆ—โˆ— indicates statistically significant difference from the free at the p = 1% level. Source: Newhouse (1993). 13. In this exercise, assume that the term โ€œadmissionโ€ in Table 2.15 refers to inpatient care, while โ€œany useโ€ refers to inpatient and outpatient care. Table 2.15 contains a lot of information. Without looking at any specific values, summarize what type of data the table contains. Give an example of a broad question about income levels and demand for health care that the table might have the potential to answer. The table contains medical utilization and expenditure data for patients in c Bhattacharya, Hyde & Tu 2013 8 Chapter 2| Demand for Health Care | 9 Table 2.15. Various measures of predicted annual use of medical services by income group. Source: Manning (1987). the RAND HIE, broken down by income tercile. The table can tell us whether people from different parts of the income distribution have different price elasticities of demand for health care in general, and for inpatient care in particular. Essay Questions 14. Here is a selection from an abstract of a recent study entitled โ€œThe Effect of Health Insurance Coverage on the Use of Medical Servicesโ€ by Michael Anderson, Carlos Dobkin, and Tal Gross: Substantial uncertainty exists regarding the causal effect of health insurance on the utilization of care. Most studies cannot determine whether the large differences in healthcare utilization between the insured and the uninsured are due to insurance status or to other unobserved differences between the two groups. In this paper, we exploit a sharp change in insurance coverage rates that results from young adults โ€œaging outโ€ of their parents insurance plans to estimate the effect of insurance coverage on the utilization of emergency department (ED) and inpatient services. [In the United States, children are eligible for insurance coverage through their parentsโ€™ insurance only up to their 23rd birthday, at which point 9 c Bhattacharya, Hyde & Tu 2013 Health Economics 1st Edition Bhattacharya Solutions Manual Full Download: https://testbanklive.com/download/health-economics-1st-edition-bhattacharya-solutions-manual/ 10 | Health Economics Answer Key they lose eligibility.] Using the National Health Interview Survey (NHIS) and a census of emergency department records and hospital discharge records from seven states, we find that aging out results in an abrupt 5 to 8 percentage point reduction in the probability of having health insurance. We find that not having insurance leads to a 40 percent reduction in ED visits and a 61 percent reduction in inpatient hospital admissions. (a) This study does not use randomization to assign people to different insurance plans. What two groups are being compared in this study? This study compared people who were just under age 23 and just over age 23. Because of the law regarding coverage through parentsโ€™ insurance, these groups have significantly different rates of insurance coverage. (b) Identify at least one important methodological differences between the design of this study and the RAND HIE. Give a hypothetical reason that this difference would bias the results. One important difference is that the study does not use randomization, but instead compares two similar groups with different health insurance coverage rates (those under age 23 and those over age 23). This methodology could bias the results if people over age 23 have less need for inpatient care than people under 23. In that case, a โ€œnaturalโ€ decline in inpatient use among 23-year-olds would be wrongly attributed to increased uninsurance. (c) Are the findings of this study generally consistent with the findings from the Oregon Medicaid Experiment? No. The Oregon Medicaid Experiment found that having health insurance had little to no effect on emergency room visits or inpatient stays, but this study finds that having health insurance makes patients much more likely to visit the emergency room and much more likely to receive inpatient care. c Bhattacharya, Hyde & Tu 2013 10 Full download all chapters instantly please go to Solutions Manual, Test Bank site: testbanklive.com

Document Preview (10 of 234 Pages)

User generated content is uploaded by users for the purposes of learning and should be used following SchloarOn's honor code & terms of service.
You are viewing preview pages of the document. Purchase to get full access instantly.

Shop by Category See All


Shopping Cart (0)

Your bag is empty

Don't miss out on great deals! Start shopping or Sign in to view products added.

Shop What's New Sign in