Solution Manual for Essentials of Statistics for the Behavioral Sciences, 2nd Edition
Preview Extract
APPENDIX C C-3
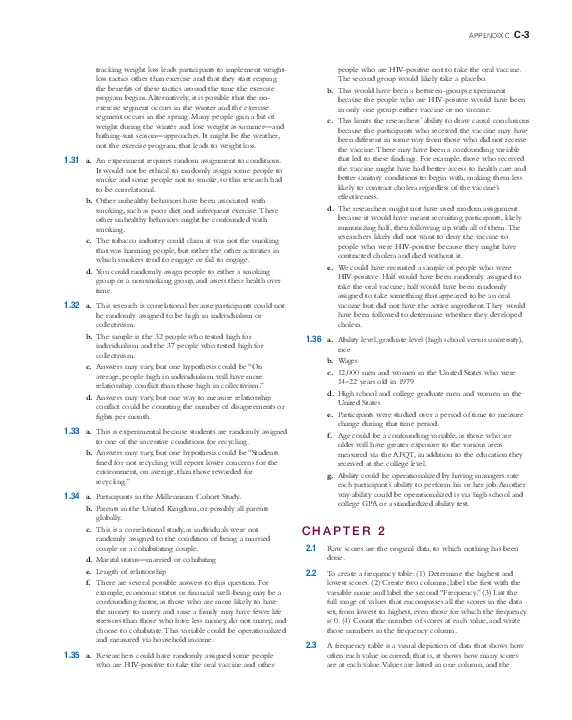
people who are HIV-positive not to take the oral vaccine.
The second group would likely take a placebo.
b. This would have been a between-groups experiment
because the people who are HIV-positive would have been
in only one group: either vaccine or no vaccine.
c. This limits the researchersโ ability to draw causal conclusions
because the participants who received the vaccine may have
been different in some way from those who did not receive
the vaccine. There may have been a confounding variable
that led to these findings. For example, those who received
the vaccine might have had better access to health care and
better sanitary conditions to begin with, making them less
likely to contract cholera regardless of the vaccineโs
effectiveness.
d. The researchers might not have used random assignment
because it would have meant recruiting participants, likely
immunizing half, then following up with all of them. The
researchers likely did not want to deny the vaccine to
people who were HIV-positive because they might have
contracted cholera and died without it.
e. We could have recruited a sample of people who were
HIV-positive. Half would have been randomly assigned to
take the oral vaccine; half would have been randomly
assigned to take something that appeared to be an oral
vaccine but did not have the active ingredient. They would
have been followed to determine whether they developed
cholera.
tracking weight loss leads participants to implement weightloss tactics other than exercise and that they start reaping
the benefits of these tactics around the time the exercise
program begins. Alternatively, it is possible that the noexercise segment occurs in the winter and the exercise
segment occurs in the spring. Many people gain a bit of
weight during the winter and lose weight as summerโand
bathing-suit seasonโapproaches. It might be the weather,
not the exercise program, that leads to weight loss.
1.31 a. An experiment requires random assignment to conditions.
It would not be ethical to randomly assign some people to
smoke and some people not to smoke, so this research had
to be correlational.
b. Other unhealthy behaviors have been associated with
smoking, such as poor diet and infrequent exercise. These
other unhealthy behaviors might be confounded with
smoking.
c. The tobacco industry could claim it was not the smoking
that was harming people, but rather the other activities in
which smokers tend to engage or fail to engage.
d. You could randomly assign people to either a smoking
group or a nonsmoking group, and assess their health over
time.
1.32 a. This research is correlational because participants could not
be randomly assigned to be high in individualism or
collectivism.
b. The sample is the 32 people who tested high for
individualism and the 37 people who tested high for
collectivism.
c. Answers may vary, but one hypothesis could be โOn
average, people high in individualism will have more
relationship conflict than those high in collectivism.โ
d. Answers may vary, but one way to measure relationship
conflict could be counting the number of disagreements or
fights per month.
1.36 a. Ability level, graduate level (high school versus university),
race
b. Wages
c. 12,000 men and women in the United States who were
14โ22 years old in 1979
d. High school and college graduate men and women in the
United States
e. Participants were studied over a period of time to measure
change during that time period.
f. Age could be a confounding variable, as those who are
older will have greater exposure to the various areas
measured via the AFQT, in addition to the education they
received at the college level.
g. Ability could be operationalized by having managers rate
each participantโs ability to perform his or her job. Another
way ability could be operationalized is via high school and
college GPA or a standardized ability test.
1.33 a. This is experimental because students are randomly assigned
to one of the incentive conditions for recycling.
b. Answers may vary, but one hypothesis could be โStudents
fined for not recycling will report lower concerns for the
environment, on average, than those rewarded for
recycling.โ
1.34 a. Participants in the Millennium Cohort Study.
b. Parents in the United Kingdom, or possibly all parents
globally.
c. This is a correlational study, as individuals were not
randomly assigned to the condition of being a married
couple or a cohabitating couple.
d. Marital statusโmarried or cohabiting
e. Length of relationship
f. There are several possible answers to this question. For
example, economic status or financial well-being may be a
confounding factor, as those who are more likely to have
the money to marry and raise a family may have fewer life
stressors than those who have less money, do not marry, and
choose to cohabitate. This variable could be operationalized
and measured via household income.
1.35 a. Researchers could have randomly assigned some people
who are HIV-positive to take the oral vaccine and other
CHAPTER 2
2.1
Raw scores are the original data, to which nothing has been
done.
2.2
To create a frequency table: (1) Determine the highest and
lowest scores. (2) Create two columns; label the first with the
variable name and label the second โFrequency.โ (3) List the
full range of values that encompasses all the scores in the data
set, from lowest to highest, even those for which the frequency
is 0. (4) Count the number of scores at each value, and write
those numbers in the frequency column.
2.3
A frequency table is a visual depiction of data that shows how
often each value occurred; that is, it shows how many scores
are at each value. Values are listed in one column, and the
C-4 APPENDIX C
numbers of individuals with scores at that value are listed in the
second column. A grouped frequency table is a visual depiction
of data that reports the frequency within each given interval,
rather than the frequency for each specific value.
2.4
2.5
Statisticians might use interval to describe a type of variable.
Interval variables have numbers as their values, and the distance
(or interval) between numbers is assumed to be equal.
Statisticians might also use interval to refer to the range of
values to be used in a grouped frequency table, histogram, or
polygon.
Bar graphs typically provide scores for nominal data, whereas
histograms typically provide frequencies for scale data. Also, the
categories in bar graphs do not need to be arranged in a
particular order and the bars should not touch, whereas the
intervals in histograms are arranged in a meaningful order
(lowest to highest) and the bars should touch each other.
2.19 0.04, 198.22, and 17.89
2.20 a. The full range is the maximum (27) minus the minimum
(0), plus 1, which equals 28.
b. Five
c. The intervals would be 0โ4, 5โ9, 10โ14, 15โ19, 20โ24, and
25โ29.
2.21 The full range of data is 68 minus 2, plus 1, or 67. The range
(67) divided by the desired seven intervals gives us an interval
size of 9.57, or 10 when rounded. The seven intervals are: 0โ9,
10โ19, 20โ29, 30โ39, 40โ49, 50โ59, and 60โ69.
2.22 37.5, 52.5, and 67.5
2.23 25 shows
2.24 Twelve countries had between 2 and 10 first- or second-place
World Cup finishes.
2.6
The x-axis is typically labeled with the name of the variable of
interest. The y-axis is typically labeled โFrequency.โ
2.25 Serial killers would create positive skew, adding high numbers
2.7
A histogram looks like a bar graph but is usually used to depict
scale data, with the values (or midpoints of intervals) of the
variable on the x-axis and the frequencies on the y-axis. A
frequency polygon is a line graph, with the x-axis representing
values (or midpoints of intervals) and the y-axis representing
frequencies; a dot is placed at the frequency for each value (or
midpoint), and the points are connected.
2.26 People convicted of murder are assumed to have killed at least
2.8
Visual displays of data often help us see patterns that are not
obvious when we examine a long list of numbers. They help us
organize the data in meaningful ways.
2.9
In everyday conversation, you might use the word distribution in
a number of different contexts, from the distribution of food to
a marketing distribution. A statistician would use distribution
only to describe the way that a set of scores, such as a set of
grades, is distributed. A statistician is looking at the overall
pattern of the dataโwhat the shape is, where the data tend to
cluster, and how they trail off.
2.10 A normal distribution is a specific frequency distribution that is
a bell-shaped, symmetric, unimodal curve.
of murders to the data that are clustered around 1.
one person, so observations below one are not seen, which
creates a floor effect.
2.27 a. For the college population, the range of ages extends farther
to the right (with a larger number of years) than to the left,
creating positive skew.
b. The fact that youthful prodigies have limited access to
college creates a sort of floor effect that makes low scores
less possible.
2.28 a. Assuming that most people go for the maximum number
of friends, for the range of Facebook friends, the
number of friends extends farther to the left (with fewer
number of friends) than to the right, creating a negative
skew.
b. The fact that Facebook cuts off or limits the number of
friends to 5000 means there is a ceiling effect that makes
higher scores impossible.
2.29 a.
PERCENTAGE
FREQUENCY
PERCENTAGE
2.11 With positively skewed data, the distributionโs tail extends to
10
1
5.26
the right, in a positive direction, and with negatively skewed
data, the distributionโs tail extends to the left, in a negative
direction.
9
0
0.00
8
0
0.00
7
0
0.00
6
0
0.00
5
2
10.53
2.13 A ceiling effect occurs when there are no scores above a
4
2
10.53
certain value; a ceiling effect leads to a negatively skewed
distribution because the upper part of the distribution is
constrained.
3
4
21.05
2
4
21.05
1
5
26.32
0
1
5.26
2.12 A floor effect occurs when there are no scores below a certain
value; a floor effect leads to a positively skewed distribution
because the lower part of the distribution is constrained.
2.14 4.98% and 2.27%
2.15 17.95% and 40.67%
2.16 3.69% and 18.11% are scale variables, both as counts and as
percentages.
2.17 0.10% and 96.77%
2.18 1,889.00, 2.65, and 0.08
b. 10.53% of these schools had exactly 4% of their students
report that they wrote between 5 and 10 twenty-page
papers that year.
c. This is not a random sample. It includes schools that chose
to participate in this survey and opted to have their results
made public.
APPENDIX C C-5
d.
f. Eight
9
2.31 a. The variable of alumni giving was operationalized by the
8
percentage of alumni who donated to a given school. There
are several other ways it could be operationalized. For
example, the data might consist of the total dollar amount
or the mean dollar amount that each school received.
7
6
Frequency
b.
5
INTERVAL
FREQUENCY
4
60โ69
1
3
50โ59
0
2
1
0
0 1
3
5
7
9
Percent of students
11
e. One
f. The data are clustered around 1% to 4%, with a high
outlier, 10%.
2.30 a.
YEARS TO COMPLETE
FREQUENCY
15
2
14
1
13
1
12
1
11
1
10
2
9
4
8
9
7
11
6
10
b. 30
c. A grouped frequency table is not necessary here. These data
are relatively easy to interpret in the frequency table.
Grouped frequency tables are useful when the list of data is
long and difficult to interpret.
d. These data are clustered around 6 to 8 years, with a long
tail of data out to a greater number of years to complete.
These data show positive skew.
e.
12
11
10
9
8
7
Frequency 6
5
4
3
2
1
0
0 1 2 3 4 5 6 7 8 9 10 11 12 13 14 15
Years
40โ49
6
30โ39
15
20โ29
21
10โ19
24
0โ9
3
c. There are many possible answers to this question. For
example, we might ask whether sports team success predicts
alumni giving or whether the prestige of the institution is a
factor (the higher the ranking, the more alumni who
donate).
d.
25
20
15
Frequency
10
5
0
0 5 15 25 35 45 55 65
Percentage of alumni donations
e.
25
20
15
Frequency
10
5
0
25
5
15
25
35
45
55
65
75
Percentage of alumni donations
f. There is one unusual scoreโ61. The distribution appears to
be positively skewed. The center of the distribution seems
to be in the 10โ29 range.
C-6 APPENDIX C
2.32 a.
INTERVAL
FREQUENCY
60โ69
1
50โ59
7
40โ49
10
30โ39
7
20โ29
2
10โ19
3
a long list would be unreadable. Grouped frequency table,
histogram, or frequency polygon
c. You would present grouped data because time to complete
carried out to seconds would produce too many unique
numbers to organize meaningfully without groupings.
Grouped frequency table, histogram, or frequency polygon
d. You would present individual data values because number
of siblings tends to take on limited values. Frequency table,
histogram, or frequency polygon
2.35 a.
b.
10
9
8
INTERVAL
FREQUENCY
300โ339
4
260โ299
7
220โ259
9
180โ219
3
7
b. This is not a random sample because only rรฉsumรฉs from
those applying for a receptionist position in his office were
included in the sample.
c. This information lets the trainees know that most of these
rรฉsumรฉs contained between 220 and 299 words. This
analysis tells us nothing about how word count might relate
to quality of rรฉsumรฉ.
6
Frequency
5
4
3
2
1
2.36 a. A histogram of grouped frequencies
0
5
15
25
35
45
55
65
Wins
c. The summary will differ for each student but should
include the following information: the data appear to be
roughly symmetric, maybe a bit negatively skewed.
d. There are many possible answers to this question. For
example, one might ask whether teams with older players
do better or worse than those with younger players.
Another study might examine whether team budget relates
to wins; thereโs a salary cap, but some teams might choose
to pay the โluxury taxโ in order to spend more. Does
spending make a difference?
b. Approximately 32
c. Approximately 27
d. Two questions we might ask are (1) How close is the
person to those photographed?, and (2) What might
account for the two peaks in these data?
e.
INTERVAL
FREQUENCY
2.33 a. Extroversion scores are most likely to have a normal
distribution. Most people would fall toward the middle,
with some people having higher levels and some having
lower levels.
b. The distribution of finishing times for a marathon is likely
to be positively skewed. The floor is the fastest possible
time, a little over 2 hours; however, some runners take as
long as 6 hours or more. Unfortunately for the very, very
slow but unbelievably dedicated runners, many marathons
shut down the finish line 6 hours after the start of the race.
c. The distribution of numbers of meals eaten in a dining hall
in a semester on a three-meal-a-day plan is likely to be
negatively skewed. The ceiling is three times per day,
multiplied by the number of days; most people who choose
to pay for the full plan would eat many of these meals. A
few would hardly ever eat in the dining hall, pulling the tail
in a negative direction.
f.
18โ20
2
15โ17
6
12โ14
2
9โ11
3
6โ8
7
3โ5
8
8
6
Frequency 4
2
0
0 1.5 4.5 7.5 10.5 13.5 16.5 19.5
Number of people pictured
2.34 a. You would present individual data values because the few
categories of eye color would result in a readable list.
Frequency table
b. You would present grouped data because it is possible for
each person to use a different amount of minutes and such
g. The data have two high points around 3โ9 and 15โ18. We
can see that the data are asymmetric to the right, creating
positive skew.
APPENDIX C C-7
2.37 a.
MONTHS
FREQUENCY
PERCENTAGE
12
1
5
11
0
0
10
1
5
9
1
5
8
0
0
7
1
5
6
1
5
5
0
0
4
1
5
3
4
20
2
2
10
1
3
15
0
5
25
5
4
3
Frequency
2
1
c.
0
1
2
3
4
5
6
7
8
9
10 11 12 13
4
Frequency 3
2
2.5
5
7.5
10 12.5 15
Months
f. 15
0
2.5
5
7.5
10
12.5
15
17.5
Months
2.38 a. The column for faculty shows a high point from 0โ7
1
0
0
g. These data are centered around the 3-month period, with
positive skew extending the data out to the 12-month
period.
h. The bulk of the data would need to be shifted from the 3month period to approximately 12 months, so that group of
women might be the focus of attention. Perhaps early
contact at the hospital and at follow-up visits after birth
would help encourage mothers to breast-feed, and to breastfeed longer. One could also consider studying the women
who create the positive skew to learn what unique
characteristics or knowledge they have that influenced their
behavior.
6
5
d.
15
14
13
12
11
10
9
Frequency 8
7
6
5
4
3
2
1
0
14
13
12
11
10
9
Frequency 8
7
6
5
4
3
2
1
0
22.5
b.
0
e.
21 0 1 2 3 4 5 6 7 8 9 10 11 12 13
Months
INTERVAL
FREQUENCY
10โ14 months
2
5โ9 months
3
0โ4 months
15
friends.
b. The column for students shows two high points around 4โ
11 and 16โ23, with some high outliers creating positive
skew.
c. The independent variable would be status, with two levels
(faculty, student).
d. The dependent variable would be number of friends.
e. A confounding variable could be age, as faculty are older
than students and tend to be less involved in social activities
or situations where making friends is common.
f. The dependent variable could be operationalized as the
number of people who appear in photographs on display
C-8 APPENDIX C
d. The researchers operationalized the variable of mentoring
success as numbers of students placed into top professorial
positions. There are many other ways this variable could
have been operationalized. For example, the researchers
might have counted numbers of student publications while
in graduate school or might have asked graduates to rate
their satisfaction with their graduate mentoring
experiences.
e. The students might have attained their professor positions
because of the prestige of their advisor, not because of his
mentoring.
f. There are many possible answers to this question. For
example, the attainment of a top professor position might
be predicted by the prestige of the institution, the number
of publications while in graduate school, or the graduate
studentโs academic ability.
in dorm rooms and offices across campus, as was done for
this study. There are several additional ways these data
could be operationalized. One way would be to record the
number of Facebook friends each person has. Another way
would be to count the number of friends each person
reports interacting with on a regular basis. This latter
method of measuring number of friends is more likely to
reveal the quality of friendship via the amount of
interaction.
2.39
FORMER
STUDENTS NOW
IN TOP JOBS
FREQUENCY
PERCENTAGE
13
1
1.85
12
0
0.00
11
0
0.00
10
0
0.00
9
1
1.85
CHAPTER 3
8
3
5.56
3.1
7
4
7.41
The biased scale lie, the sneaky sample lie, the interpolation lie,
the extrapolation lie, and the inaccurate values lie.
6
5
9.26
3.2
5
9
16.67
4
8
14.81
3
23
42.59
(1) Organize the data by participant; each participant will have
two scores, one on each scale variable. (2) Label the horizontal
x-axis with the name of the independent variable and its
possible values, starting with 0 if practical. (3) Label the vertical
y-axis with the name of the dependent variable and its possible
values, starting with 0 if practical. (4) Make a mark on the
graph above each study participantโs score on the x-axis and
across from his or her score on the y-axis.
3.3
To convert a scatterplot to a range-frame, simply erase the axes
below the minimum score and above the maximum score.
15
3.4
A linear relation between variables means that the relation
between variables is best described by a straight line.
10
3.5
With scale data, a scatterplot allows for a helpful visual analysis
of the relation between two variables. If the data points appear
to fall approximately along a straight line, this indicates a linear
relation. If the data form a line that changes direction along its
path, a nonlinear relation may be present. If the data points
show no particular relation, it is possible that the two variables
are not related.
3.6
A line graph is used to illustrate the relation between two scale
variables. One type of line graph is based on a scatterplot and
allows us to construct a line of best fit that represents the
predicted y scores for each x value. A second type of line graph
allows us to visualize changes in the values on the y-axis over
time. A time plot, or time series plot, is a specific type of line
graph. It is a graph that plots a scale variable on the y-axis as it
changes over an increment of time (e.g., second, day, century)
recorded on the x-axis.
3.7
A bar graph is a visual depiction of data in which the
independent variable is nominal or ordinal and the dependent
variable is scale. Each bar typically represents the mean value of
the dependent variable for each category. A Pareto chart is a
specific type of bar graph in which the categories along the xaxis are ordered from highest bar on the left to lowest bar on
the right.
a.
25
20
Frequency
5
0
0
1
2
3
4
5 6 7 8 9 10 11 12 13
Number of students
b.
25
20
15
Frequency
10
5
0
1 2 3 4 5 6 7 8 9 10 11 12 13 14 15 16
Number of students mentored by each different professor
c. This distribution is positively skewed.
Document Preview (6 of 29 Pages)
User generated content is uploaded by users for the purposes of learning and should be used following SchloarOn's honor code & terms of service.
You are viewing preview pages of the document. Purchase to get full access instantly.
-37%
Solution Manual for Essentials of Statistics for the Behavioral Sciences, 2nd Edition
$18.99 $29.99Save:$11.00(37%)
24/7 Live Chat
Instant Download
100% Confidential
Store
Liam Anderson
0 (0 Reviews)
Best Selling
The World Of Customer Service, 3rd Edition Test Bank
$18.99 $29.99Save:$11.00(37%)
Chemistry: Principles And Reactions, 7th Edition Test Bank
$18.99 $29.99Save:$11.00(37%)
Test Bank for Hospitality Facilities Management and Design, 4th Edition
$18.99 $29.99Save:$11.00(37%)
Solution Manual for Designing the User Interface: Strategies for Effective Human-Computer Interaction, 6th Edition
$18.99 $29.99Save:$11.00(37%)
Data Structures and Other Objects Using C++ 4th Edition Solution Manual
$18.99 $29.99Save:$11.00(37%)
2023-2024 ATI Pediatrics Proctored Exam with Answers (139 Solved Questions)
$18.99 $29.99Save:$11.00(37%)