Solution Manual for Engineering Economics Financial Decision Making for Engineers, 6th Edition

Preview Extract
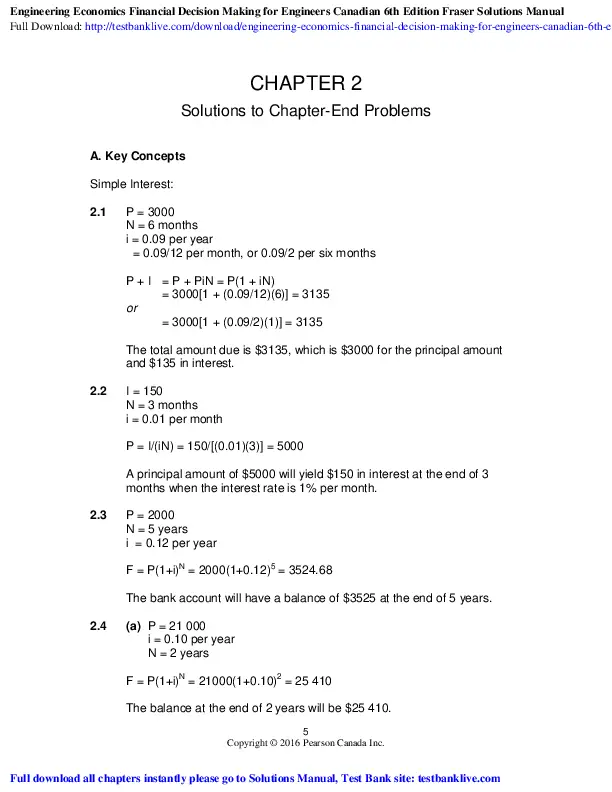
Engineering Economics Financial Decision Making for Engineers Canadian 6th Edition Fraser Solutions Manual Full Download: http://testbanklive.com/download/engineering-economics-financial-decision-making-for-engineers-canadian-6th-ed CHAPTER 2 Solutions to Chapter-End Problems A. Key Concepts Simple Interest: 2.1 P = 3000 N = 6 months i = 0.09 per year = 0.09/12 per month, or 0.09/2 per six months P + I = P + PiN = P(1 + iN) = 3000[1 + (0.09/12)(6)] = 3135 or = 3000[1 + (0.09/2)(1)] = 3135 The total amount due is $3135, which is $3000 for the principal amount and $135 in interest. 2.2 I = 150 N = 3 months i = 0.01 per month P = I/(iN) = 150/[(0.01)(3)] = 5000 A principal amount of $5000 will yield $150 in interest at the end of 3 months when the interest rate is 1% per month. 2.3 P = 2000 N = 5 years i = 0.12 per year F = P(1+i)N = 2000(1+0.12)5 = 3524.68 The bank account will have a balance of $3525 at the end of 5 years. 2.4 (a) P = 21 000 i = 0.10 per year N = 2 years F = P(1+i)N = 21000(1+0.10)2 = 25 410 The balance at the end of 2 years will be $25 410. 5 Copyright ยฉ 2016 Pearson Canada Inc. Full download all chapters instantly please go to Solutions Manual, Test Bank site: testbanklive.com Chapter 2 – Time Value of Money (b) P = 2 900 i = 0.12 per year = 0.01 per month N = 2 years = 24 months F = P(1+i)N = 2900(1+0.01)24 = 3682.23 The balance at the end of 24 months (2 years) will be $3682.23. 2.5 From: F = P(1 + i)N P = F/(1 + i)N = 50 000/(1 + 0.01)20 = 40977.22 Greg should invest about $40 977. 2.6 F = P(1 + i)N 50 000 = 20 000(1 + i)20 (1+i)20 = 5/2 i = (5/2)1/20 โˆ’ 1 = 0.04688 = 4.688% per quarter = 18.75% per year The investment in mutual fund would have to pay at least 18.75% nominal interest, compounded quarterly. Cash Flow Diagrams: 2.7 Cash flow diagram: $6000 $2000 0 1 2 3 4 5 6 $900 2.8 Showing cash flow elements separately: 6 Copyright ยฉ 2016 Pearson Canada Inc. Chapter 2 – Time Value of Money $100 0 1 2 3 4 5 6 7 8 9 10 11 12 $300 $500 Showing net cash flow: $100 0 1 2 3 4 5 6 7 8 9 10 11 12 $200 $500 2.9 Showing cash flow elements separately: $10000 $10000 0 1 2 3 $15000 4 5 6 $15000 7 8 9 10 $15000 $20000 Showing net cash flow: 7 Copyright ยฉ 2016 Pearson Canada Inc. 11 12 $15000 Chapter 2 – Time Value of Money $10000 $10000 $10000 $10000 $5000 0 1 3 2 4 6 5 7 8 9 $5000 $5000 10 11 12 $5000 $20000 2.10 The calculation of the net cash flow is summarized in the table below. Time 0 1 2 3 4 5 6 7 8 9 10 11 12 Payment 20 Receipt Net โˆ’20 30 33 16.3 39.9 43.9 28.3 53.1 58.5 44.3 70.7 77.8 65.6 30 33 36.3 39.9 43.9 48.3 53.1 58.5 64.3 70.7 77.8 85.6 20 20 20 20 Cash flow diagram: $70.7 $53.1 $65.5 $58.5 $39.9 $43.9 $30 $77.8 $44.3 $33 $28.3 $16.3 0 1 2 3 4 5 6 7 8 9 10 $20 2.11 (a) functional loss (b) use-related physical loss (c) functional loss 8 Copyright ยฉ 2016 Pearson Canada Inc. 11 12 Chapter 2 – Time Value of Money (d) time-related physical loss (e) use-related physical loss (f) use-related physical loss (g) functional loss (h) time-related physical loss 2.12 (a) market value (b) salvage value (c) scrap value (d) market value to Liam, salvage value to Jacque (e) book value 2.13 The book value of the company is $4.5 based on recent financial statements. The market value is $7 million, assuming that the bid is real and would actually be paid. 2.14 Since sewing machine technology does not change very quickly nor does the required functionality, functional loss will probably not be a major factor in the depreciation of this type of asset. Left unused, but cared for, the machine will lose some value, and hence time-related loss may be present to some extent. The greatest source of depreciation on a machine will likely be use-related and due to wear and tear on the machine as it is operated. 2.15 A switch will generally not suffer wear and tear due to use, and thus userelated physical loss is not likely to be a big factor. Nor will there likely be a physical loss due to the passage of time. The primary reason for depreciation will be functional loss – the price of a similar new unit will likely have dropped due to development of new technology and competition in the marketplace. 2.16 The depreciation is certainly not due to use related physical loss, or other non-physical losses in functionality. The depreciation is a time-related physical loss because it has not being used and maintained over time. 2.17 (a) BV(1) = 14 000 โ€“ (14 000 โ€“ 3000)/7 = $12 429 (b) BV(4) = 14 000 โ€“ 4ร—(14 000 โ€“ 3000)/7 = $7714 (c) BV(7) = 3000 2.18 (a) BV(1) = 14 000(1 โ€“ 0.2) = $11 200 (b) BV(4) = 14 000(1 โ€“ 0.2)4 = $5 734 (c) BV(7) = 14 000(1 โ€“ 0.2)7 = $2936 2.19 (a) d = 1 โ€“ (3000/14 000)1/7 = 19.75% (b) BV(4) = 14 000(1โ€“ 0.1975)4 = $5806 9 Copyright ยฉ 2016 Pearson Canada Inc. Chapter 2 – Time Value of Money Spreadsheet used for chart: Year 0 1 2 3 4 5 6 7 Straight Line 14000 12429 10857 9286 7714 6143 4571 3000 Declining Balance 14000 11200 8960 7168 5734 4588 3670 2936 14000 12000 Book value ($) 2.20 10000 Straight line 8000 6000 4000 Declining balance 2000 0 0 1 2 3 4 5 Year 10 Copyright ยฉ 2016 Pearson Canada Inc. 6 7 Chapter 2 – Time Value of Money 2.21 Spreadsheet used for chart: Year 0 1 2 3 4 5 6 7 8 9 10 d = 5% 150000 142500 135375 128606 122176 116067 110264 104751 99513 94537 89811 d = 20% 150000 120000 96000 76800 61440 49152 39322 31457 25166 20133 16106 d = 30% 150000 105000 73500 51450 36015 25211 17647 12353 8647 6053 4237 Book value ($) 150000 5% 100000 50000 20% 30% 0 0 5 10 Year B. Applications 2.22 I = 190.67 P = 550 N = 4 1/3 = 13/3 years i = I/(PN) = 190.67/[550(13/3)] = 0.08 The simple interest rate is 8% per year. 2.23 F = P(1 + i)N 50 000 = 20 000(1 + 0.01)N (1.01)N = 5/2 N = ln(5/2)/ln(1.01) = 92.09 quarters = 23.02 years Greg would have to invest his money for about 23.02 years to reach his target. 2.24 F = P(1 + i)N = 20 000(1 + 0.01)20 = 24 403.80 11 Copyright ยฉ 2016 Pearson Canada Inc. Chapter 2 – Time Value of Money Greg would have accumulated about $24 404. 2.25 (a) P = 5000 i = 0.05 per six months F = 8000 From: F = P(1 + i)N N = ln(F/P)/ln(1 + i) = ln(8000/5000)/ln(1 + 0.05) = 9.633 The answer that we get is 9.633 (six-month) periods. But what does this mean? It means that after 9 compounding periods, the account will not yet have reached $8000. (You can verify yourself that the account will contain $7757). Since compounding is done only every six months, we must, in fact, wait 10 compounding periods, or 5 years, for the deposit to be worth more than $8000. At that time, the account will hold $8144. (b) P = 5000 r = 0.05 (for the full year) F = 8000 i = r/m = 0.05/2 = 0.025 per six months From: F = P(1 + i)N N = ln(F/P)/ln(1 + i) = ln(8000/5000)/ln(1 + 0.025) = 19.03 We must wait 20 compounding periods, or 10 years, for the deposit to be worth more than $8000. 2.26 P = 500 F = 708.31 i = 0.01 per month From: F = P(1 + i)N N = ln(F/P)/ln(1 + i) = ln(708.31/500)/ln(1 + 0.01) = 35.001 The deposit was made 35 months ago. 2.27 (a) P = 1000 i = 0.1 N = 20 F = P(1 + i)N = 1000(1+0.1)20 = 6727.50 12 Copyright ยฉ 2016 Pearson Canada Inc. Chapter 2 – Time Value of Money About $6728 could be withdrawn 20 years from now. (b) F = PiN = 1000(0.1)(20) = 2000 Without compounding, the investment account would only accumulate $2000 over 20 years. 2.28 Let P = X and F = 2X. (a) By substituting F = 2X and P = X into the formula, F = P + I = P + PiN, we get 2X = X + XiN = X(1 + iN) 2 = 1 + iN iN = 1 N = 1/i = 1/0.11 = 9.0909 It will take 9.1 years. (b) From F = P(1 + i)N, we get N = ln(F/P)/ln(1 + i). By substituting F = 2X and P = X into this expression of N, N = ln(2X/X)/ln(1 + 0.11) = ln(2)/ln(1.11) = 6.642 Since compounding is done every year, the amount will not double until the 7th year. (c) Given r = 0.11 per year, the effective interest rate is i = er โˆ’ 1 = 0.1163. From F = P(1 + i)N, we get N = ln(F/P)/ln(1 + i). By substituting F = 2X and P = X into this expression of N, N = ln(2X/X)/ln(1 + 0.1163) = ln(2)/ln(1.1163) = 6.3013 Since interest is compounded continuously, the amount will double after 6.3 years. 2.29 (a) r = 0.25 and m = 2 i e = (1 + r/m)m โˆ’ 1 = (1 + 0.25/2)2 โˆ’ 1 = 0.26563 The effective rate is approximately 26.6%. (b) r = 0.25 and m = 4 i e = (1 + r/m)m โˆ’ 1 = (1 + 0.25/4)2 โˆ’ 1 = 0.27443 13 Copyright ยฉ 2016 Pearson Canada Inc. Chapter 2 – Time Value of Money The effective rate is approximately 27.4%. (c) i e = er โˆ’ 1 = e0.25 โˆ’ 1 = 0.28403 The effective rate is approximately 28.4%. 2.30 (a) i e = 0.15 and m = 12 From: i e = (1 + r/m)m โˆ’ 1 r = m[(1 + i e )1/m โˆ’ 1] = 12[(1 + 0.15)1/12 โˆ’ 1] = 0.1406 The nominal rate is 14.06%. (b) i e = 0.15 and m = 365 From: i e = (1 + r/m)m โˆ’ 1 r = m[(1 + i e )1/m โˆ’ 1] = 365[(1 + 0.15)1/365 โˆ’ 1] = 0.13979 The nominal rate is 13.98%. (c) For continuous compounding, we must solve for r in i e = er โˆ’ 1: r = ln(1 + i e ) = ln(1 + 0.15) = 0.13976 The nominal rate is 13.98%. 2.31 F = P(1 + i)N 14 800 = 665(1 + i)64 i = 0.04967 The rate of return on this investment was 5%. 2.32 The present value of X is calculated as follows: F = P(1 + i)N 3500 = X(1 + 0.075)5 X = 2437.96 The value of X in 10 years is then: F = 2437.96(1 + 0.075/365)3650 = 4909.12 14 Copyright ยฉ 2016 Pearson Canada Inc. Chapter 2 – Time Value of Money The present value of X is $2438. In 10 years, it will be $4909. 2.33 r = 0.02 and m = 365 i e = (1 + r/m)m โˆ’ 1 = (1 + 0.02/365)365 โˆ’ 1 = 0.0202 The effective interest rate is about 2.02%. 2.34 Effective interest for continuous interest account: i e = er โˆ’ 1 = e0.0599 โˆ’ 1 = 0.08318 = 6.173% Effective interest for daily interest account: i e = (1 + r/m)m โˆ’ 1 = (1 + 0.08/365)365 โˆ’ 1 = 0.08328 = 8.328% No, your money will earn less with continuous compounding. 2.35 i e (weekly) = (1 + r/m)m โˆ’ 1 = (1 + 0.055/52)52 โˆ’ 1 = 0.0565 = 5.65% i e (monthly) = (1 + r/m)m โˆ’ 1 = (1 + 0.07/12)12 โˆ’ 1 = 0.0723 = 7.23% 2.36 i e (Victory Visa) = (1 + r/m)m โˆ’ 1 = (1 + 0.26/365)365 โˆ’ 1 = 0.297 = 29.7% i e (Magnificent Master Card) = (1 + 0.28/52)52 โˆ’ 1 = 0.322 = 32.2% i e (Amazing Express) = (1 + 0.3/12)12 โˆ’ 1 = 0.345 = 34.5% Victory Visa has the lowest effective interest rate, so based on interest rate, Victory Visa seems to offer the best deal. 2.37 First, determine the effective interest rate that May used to get $2140.73 from $2000. Then, determine the nominal interest rate associated with the effective interest: F = P(1 + i e )N 2140.73 = 2000(1 + i e )1 i e = 0.070365 i e = er โˆ’ 1 0.070365 = er โˆ’ 1 r = 0.068 The correct effective interest rate is then: i e = (1 + r/m)m โˆ’ 1 = (1 + 0.068/12)12 โˆ’ 1 = 0.07016 The correct value of $2000 a year from now is: F = P(1 + i e )N = 2000(1 + 0.07016)1 = $2140.32 15 Copyright ยฉ 2016 Pearson Canada Inc. Chapter 2 – Time Value of Money 2.38 The calculation of the net cash flow is summarized in the table below. Time 0 1 2 3 4 5 6 7 8 9 10 11 12 Investment A Payment Receipt 2400 250 250 250 250 250 250 250 250 250 250 250 200 250 Net โˆ’2400 250 250 250 250 250 250 250 250 250 250 250 50 Investment B Payment Receipt 50 100 150 200 250 300 350 400 450 500 550 600 500 500 500 500 500 500 Cash flow diagram for investment A: $250 $50 0 1 2 3 4 5 6 7 8 9 10 $2400 Cash flow diagram for investment B: 16 Copyright ยฉ 2016 Pearson Canada Inc. 11 12 Net 0 50 โˆ’400 150 โˆ’300 250 โˆ’200 350 โˆ’100 450 0 550 100 Chapter 2 – Time Value of Money $550 $450 $350 $250 $150 $100 $50 0 1 2 3 4 5 6 7 8 9 10 11 12 $100 $200 $300 $400 Since the cash flow diagrams do not include the time factor (i.e., interest), it is difficult to say which investment may be better by just looking at the diagrams. However, one can observe that investment A offers uniform cash inflows whereas B alternates between positive and negative cash flows for the first 10 months. On the other hand, investment A requires $2400 up front, so it may not be a preferred choice for someone who does not have a lump sum of money now. 2.39 (a) The amount owed at the end of each year on a loan of $100 using 6% interest rate: Year 0 1 2 3 4 5 6 7 8 9 10 Simple Interest Compound Interest 100 100.00 106 106.00 112 112.36 118 119.10 124 126.25 130 133.82 136 141.85 142 150.36 148 159.38 154 168.95 160 179.08 17 Copyright ยฉ 2016 Pearson Canada Inc. Chapter 2 – Time Value of Money 180 Amount owed ($) 170 160 Compound interest 150 140 130 Simple interest 120 110 100 0 1 2 3 4 5 6 7 8 9 10 Year (b) The amount owed at the end of each year on a loan of $100 using 18% interest rate: Year 0 1 2 3 4 5 6 7 8 9 10 Simple Interest Compound Interest 100 100.00 118 118.00 136 139.24 154 164.30 172 193.88 190 228.78 208 269.96 226 318.55 244 375.89 262 443.55 280 523.38 Amount owed ($) 600 500 400 Compound interest 300 200 Simple interest 100 0 1 2 3 4 5 6 7 8 Year 18 Copyright ยฉ 2016 Pearson Canada Inc. 9 10 Chapter 2 – Time Value of Money 2.40 (a) From F = P(1 + i)N, we get N = ln(F/P)/ln(1 + i). At i = 12%: N = ln(1 000 000/0.01)/ln(1 + 0.12) = 162.54 years At i = 18%: N = ln(F/P)/ln(1 + i) = ln(1 000 000/0.01)/ln(1 + 0.18) = 111.29 years (b) The growth in values of a penny as it becomes a million dollars: Year 0 10 20 30 40 50 60 70 80 90 100 110 120 130 140 150 160 170 180 2.41 At 12% 0.01 0.03 0.10 0.30 0.93 2.89 8.98 27.88 86.58 268.92 835.22 2 594.07 8 056.80 25 023.21 77 718.28 241 381.18 749 693.30 2 328 433.58 7 231 761.26 At 18% 0.01 0.05 0.27 1.43 7.50 39.27 205.55 1 075.82 5 630.68 29 470.04 154 241.32 807 273.70 4 225 137.79 22 113 676.39 115 739 345.70 605 760 702.48 3 170 451 901.72 16 593 623 884.84 86 848 298 654.83 From the table and the charts below, we can see that $100 will double in (a) 105 months (or 8.75 years) if interest is 8% compounded monthly (b) 13 six-month periods (6.5 years) if interest is 11% per year, compounded semi-annually (c) 5.8 years if interest is 12% per year compounded continuously Month 0 12 24 36 48 60 72 8% 100.00 108.30 117.29 127.02 137.57 148.98 161.35 11% 100.00 111.30 123.88 137.88 153.47 170.81 190.12 12% 100.00 112.75 127.12 143.33 161.61 182.21 205.44 19 Copyright ยฉ 2016 Pearson Canada Inc. Chapter 2 – Time Value of Money Deposit ($) 84 96 108 174.74 189.25 204.95 211.61 235.53 262.15 231.64 261.17 294.47 12% 300 280 260 240 220 200 180 160 140 120 100 11% 8% 0 20 40 60 80 100 120 Month 2.42 P(1 โ€“ d)n = P โ€“ n(P โ€“ S)/N 245 000(1 โ€“ d)20 = 245 000 โ€“ 20(245 000 โ€“ 10 000)/30 (1 โ€“ d)20 = 88 333.33/245 000 = 0.3605 1 โ€“ d = 0.9503 d = 4.97% The two will be equal in 20 years with a depreciation rate of 4.97%. 2.43 780 000(1 โ€“ d)20 = 60 000 (1 โ€“ d)20 = 1/13 d = 1 โ€“ (1/13)1/20 = 1 โ€“ 0.8796 = 0.1204 A depreciation rate of about 12% will produce a book value in 20 years equal to the salvage value of the press. 2.44 (a) BV(4) = 150 000 โ€“ 4[(150 000 โ€“ 25 000)/10] = 150 000 โ€“ 4(12 500) = 150 000 โ€“ 50 000 = 100 000 DC(5) = (150 000 โ€“ 25 000)/10 = 12 500 (b) BV(n) = 150 000(1 โ€“ 0.2)4 = 150 00(0.8)4 = 61 440 DC(5) = BV(4)ร—0.2 = 61 440(0.2) = 12 288 (c) d = 1 โ€“ (25 000/150 000)1/10 = 0.1640 = 16.4% C. More Challenging Problems 2.45 The present worth of each instalment: 20 Copyright ยฉ 2016 Pearson Canada Inc. Chapter 2 – Time Value of Money Instalment 1 2 3 4 5 6 7 8 9 10 F 100000 100000 100000 100000 100000 100000 100000 100000 100000 100000 Total P 100000 90521 81941 74174 67143 60779 55018 49803 45082 40809 665270 Sample calculation for the third instalment, which is received at the end of the second year: P = F/(1 + r/m)N = 100 000/(1 + 0.10/12)24 = 81 941 The total present worth of the prize is $665 270, not $1 000 000. 2.46 The present worth of the lottery is $665 270. If you take $300 000 today, that leaves a present worth of $365 270. The future worth of $365 270 in 5 years (60 months) is: F = P(1 + r/m)N = 365 270(1 + 0.10/12)60 = 600 982 The payment in 5 years will be $600 982. 2.47 The first investment has an interest rate of 1% per month (compounded monthly), the second 6% per 6 month period (compounding semiannually). (a) Effective semi-annual interest rate for the first investment: i e = (1 + i s )N โˆ’ 1 = (1 + 0.01)6 โˆ’ 1 = 0.06152 = 6.152% Effective semi-annual interest rate for the second investment is 6% as interest is already stated on that time period. (b) Effective annual interest rate for the first investment: i e = (1 + i s )N โˆ’ 1 = (1 + 0.01)12 โˆ’ 1 = 0.1268 = 12.68% Effective annual interest rate for the second investment: i e = (1 + i s )N โˆ’ 1 = (1 + 0.06)2 โˆ’ 1 = 0.1236 = 12.36% 21 Copyright ยฉ 2016 Pearson Canada Inc. Chapter 2 – Time Value of Money (c) The first investment is the preferred choice because it has the higher effective interest rate, regardless of on what period the effective rate is computed. 2.48 (a) i = 0.15/12 = 0.0125, or 1.25% per month The effective annual rate is: i e = (1 + i)m โˆ’ 1 = (1 + 0.0125)12 โˆ’ 1 = 0.1608 or 16.08% (b) P = 50 000 N = 12 i = 0.15/12 = 0.0125, or 1.25% per month F = P(1 + i)N = 50 000(1 + 0.0125)12 = 58 037.73 You will have $58 038 at the end of one year. (c) Adam’s Fee = 2% of F = 0.02(58037.73) = 1160.75 Realized F = 58 037.73 โˆ’ 1160.75 = 56 876.97 The effective annual interest rate is: F = P(1 + i)1 56 876.97 = 50 000(1 + i) i = 56 876.97/50 000 โˆ’ 1 = 0.1375 or 13.75% The effective interest rate of this investment is 13.75%. 2.49 Market equivalence does not apply as the cost of borrowing and lending is not the same. Mathematical equivalence does not hold as neither 2% nor 4% is the rate of exchange between the $100 and the $110 one year from now. Decisional equivalence holds as you are indifferent between the $100 today and the $110 one year from now. 2.50 Decisional equivalence holds since June is indifferent between the two options. Mathematical equivalence does not hold since neither 8% compounded monthly (lending) or 8% compounded daily (borrowing) is the rate of exchange representing the change in the house price ($110 000 now and $120 000 a year later is equivalent to the effective interest rate of 9.09%). Market equivalence also does not hold since the cost of borrowing and lending is not the same. 2.51 (a) The amount of the initial deposit, P, can be found from F = P(1 + i)N 22 Copyright ยฉ 2016 Pearson Canada Inc. Chapter 2 – Time Value of Money with F = $3000, N = 36, and i = 0.10/12. (b) Having determined P = $2225, then we can figure out the size of the deposit at the end of years 1, 2 and 3. If you had not invested in the fixed interest rate investment, you would have obtained interest rates of 8%, 10%, and 14% for each of the three years. The table below shows how much the initial deposit would have been worth at the end of each of the three years if you had been able to reinvest each year at the new rate. Because of the surge in interest rates in the third year, with 20/20 hindsight, you would have been better off (by about $60) not to have locked in at 10% for three years. Deposit amount ($) Year 0 1 2 3 Fixed Interest Rate Varying Interest Rate 2225 2225 2458 2410 2715 2662 3000 3060 3200 3000 2800 Fixed interest rate 2600 Varying interest rate 2400 2200 0 1 2 3 Year 2.52 Interest rate i likely has its origins in commonly available interest rates present in Marleeโ€™s financial activities such as investing or borrowing money. Interest rate j can only be determined by having Marlee choose between X and Y to determine at which interest rate Marlee is indifferent between the choice. Interest rate k probably does not exist for Martlee, since it is unlikely that she can borrow and lend money at the same interest rate. If for some reason she could, then k=j. Also, i could be either greater or less than j. 2.53 BV(0) = 250 000 BV(6) = 250 000ร—(1 โˆ’ 0.3)6 = 29 412.25 The book values of the conveyor after 7, 8, 9, and 10 years are: 23 Copyright ยฉ 2016 Pearson Canada Inc. Chapter 2 – Time Value of Money BV(7) = 29 412.25 โˆ’ 29 412.25/4ร—1 = 22 059.19 BV(8) = 29 412.25 โˆ’ 29 412.25/4ร—2 = 14 706.13 BV(9) = 29 412.25 โˆ’ 29 412.25/4ร—3 = 7353.07 BV(10) = 29 412.25 โˆ’ 29 412.25/4ร—4 = 0 2.54 d = 1 โ€“ (S/P)1/n = 1 โ€“ (8300/12 500)1/2 = 1โ€“ 0.81486 = 0.18514 = 18.514% BV db (5) = 12 500 (1 โ€“ 0.18514)5 = 4470.87 Enrique should expect to get about $4471 for his car three years from now. 24 Copyright ยฉ 2016 Pearson Canada Inc. Chapter 2 – Time Value of Money Notes for Case-in-Point 2.1 1) Close, if the appropriate depreciation method is being used. 2) It makes sense because it is a new technology. 3) Because the accounting department is likely using a specific depreciation method that is not particularly accurate in this case. In particular, they may be using a depreciation method required for tax purposes. 4) Bill Fisher is probably not doing anything wrong, but it wouldnโ€™t hurt to check.. 25 Copyright ยฉ 2016 Pearson Canada Inc. Chapter 2 – Time Value of Money Notes for Mini-Case 2.1 3) Money will always be lost over the year. If money could be gained, everybody would borrow as much money as possible to invest. Solutions to All Additional Problems Note: Solutions to odd-numbered problems are provided on the Student CD-ROM. 2S.1 You can assume that one month is the shortest interval of time for which the quoted rental rates and salaries apply. Assembling the batteries will require 24 person-months, and the associated rental space. To maximize the interest you receive from your savings, and minimize the interest you pay on your line of credit, you should defer this expenditure till as late in the year as possible. So you leave your money in the bank till December 1, then purchase the necessary materials and rent the industrial space. Assume that salaries will be paid at the end of the month. As of December 1, you have $100 000(1.005)11 = $105 640 in the bank. You need to spend $360 000 on materials and $240 000 to rent space. After spending all you have in the bank, you therefore need to borrow an additional $494 360 against your line of credit. As of December 31, you owe $494 360(1.01) = $499 304 to the bank, and you owe $240 000 in salaries. So after depositing the government cheque and paying these debts, you have 1 200 000 โ€“ 499 304 โ€“ 240 000 = $460 696 in the bank. This example illustrates one of the reasons why Just-in-Time (โ€œJITโ€) manufacture has become popular in recent years: You want to minimize the time that capital is tied up. An additional motivation for JIT would become evident if you were to consider the cost of storing the finished batteries before delivery. Be aware, however, that the JIT approach also carries risks. December is typically a time when labour, space, and credit are in high demand so there is a possibility that the resources you need will be unavailable or more expensive than expected, and there will then be no time to recover. We will look at methods for managing risk in Chapter 12. 2S.2 26 Copyright ยฉ 2016 Pearson Canada Inc. Chapter 2 – Time Value of Money We want to solve the equation Future worth = Present worth (1+i)N, where the future worth is twice the present worth. So we have 2 = (1+i)N Taking logarithms on both sides, we get N = log(2) / log(1+i) For small values of i, log (1+i) is approximately i (this can be deduced from the Taylor series). And log(2) = 0.69315. So, expressing i as a percentage rather than a fraction, we have: N = 69.3 / i Since this is only an approximation, we will adjust 69.3 to an easily factored integer, 72, thus obtaining N = 72 / i 2S.3 Gita is paying 15% on her loan over a two-week period, so the effective annual rate is (1.1526 โˆ’1) ร— 100% = 3686% The Grameen Bank was awarded the Nobel Peace Prize in 2006 for making loans available to poor investors in Bangladesh at more reasonable rates. 2S.4 Five hundred years takes us beyond the scope of the tables in Appendix A, so we employ the formula P = F / (1+i)N to find the present value of the potential loss. In this case, we have P = $1 000 000 000 / (1.05)500 = $0.025, or two-and-a-half cents. This implies that it is not worth going to any trouble to make the waste repository safe for that length of time. This is a rather troubling conclusion, because the example is not imaginary; the U.S., for example, is currently trying to design a nuclear waste repository under Yucca Mountain in Nevada that will be secure for ten thousand yearsโ€”twenty 27 Copyright ยฉ 2016 Pearson Canada Inc. Chapter 2 – Time Value of Money times as long as in our example. It is not clear how the engineers involved in the project can rationally plan how to allocate their funds, since the tool we usually use for that purposeโ€”engineering economicsโ€”gives answers that seem irrational. 2S.5 There is no โ€œrightโ€ answer to this question, which is intended for discussion in class or in a seminar. Some of the arguments that might be advanced are as follows: One option is to say, โ€œYou cannot play the numbers game with human lives. Each life is unique and of inestimable value. Attempting to treat lives on the same basis as dollars is both cold-blooded and ridiculous.โ€ But this really wonโ€™t do. Medical administrators, for example, do have a responsibility to save lives, and they have limited resources to meet this responsibility. If they are to apportion their resources rationally, they must be prepared to compare the results of different strategies. To support the point of view that future lives saved should be discounted by some percentage in comparison with present lives, the following arguments might be offered: 1. Suppose we make the comparison fifty years in the future. If we spend our resources on traffic police, we will have saved the lives of those who would have died in accidents, and, because we spent the money that way, the world of fifty years hence will also contain the descendants of those who would have died. So the total number of live humans will be increased by more than fifty. (This argument assumes that creating a new life is of the same value as preserving an existing life. We do not usually accept that assumption; for example, many governments may promote population control by limiting the number of children born, but it would be unacceptable to control the population by killing off the old and infirm. To give another example, if I am accused of murder, it would not be an acceptable defence to argue that I have fathered two children, and have thus made a greater contribution to society than a law-abiding bachelor.) 2. Just as I charge you interest on a loan because of the uncertainty of what might happen between now and the due dateโ€”you could go bankrupt, I could die, etc.โ€”so we should discount future lives saved because we cannot anticipate how the world will change before the saving is realized. For example, a cure for cancer could be discovered ten years from now, and then all the money spent on the anti-smoking campaign will have been wasted, when it could have been used to save lives lost in highway accidents. 3. We should not be counting numbers of lives, but years of human life. Thus it is better to spend the money on preventing accidents, because these kill people of all ages, while cancer and heart disease are mostly diseases of later 28 Copyright ยฉ 2016 Pearson Canada Inc. Chapter 2 – Time Value of Money life; so more years of human life are saved by the first strategy. 4. The world population is growing. Thus, for humanity as a whole, losing a fixed number of lives can more easily be born in the future than it can now. (This is an extension of the argument that it is worse to kill a member of an endangered species than of a species that is plentiful.) 29 Copyright ยฉ 2016 Pearson Canada Inc. Engineering Economics Chapter 2 Time Value of Money Copyright ยฉ 2017 Pearson Canada Inc. 2-1 Engineering Economics, Sixth Edition Outline 2.1 Introduction 2.2 Interest and Interest Rates 2.3 Compound and Simple Interest 2.3.1 Compound Interest 2.3.2 Simple Interest 2.4 Effective and Nominal Interest Rates 2.5 Continuous Compounding 2.6 Cash Flow Diagrams 2.7 Depreciation 2.7.1 Reasons for Depreciation 2.7.2 Value of an Asset 2.7.3 Straight-Line Depreciation 2.7.4 Declining Balance Depreciation 2.8 Equivalence 2.8.1 Mathematical Equivalence 2.8.2 Decisional Equivalence 2.8.3 Market Equivalence Copyright ยฉ 2017 Pearson Canada Inc. 2-2 Engineering Economics, Sixth Edition 2.1 Introduction โ€ข Engineering decisions frequently involve tradeoffs among costs and benefits occurring at different times โ€“ Typically, we invest in project today to gain future benefits โ€ข Chapter 2 discusses economic methods used to compare benefits and costs occurring at different times โ€ข The key to making these comparisons is the use of interest rates discussed in Sections 2.2 to 2.5 โ€ข Section 2.6 introduces Cash Flow Diagrams โ€ข Section 2.7 explains Depreciation models โ€ข Section 2.8 discusses the equivalence of costs and benefits that occur at different times Copyright ยฉ 2017 Pearson Canada Inc. 2-3 Engineering Economics, Sixth Edition 2.2 Interest and Interest Rates โ€ข Interest (I) is compensation for giving up use of money โ€“ difference between the amount loaned and the amount repaid โ€ข An amount of money today, P, can be related to a future amount, F, by the interest amount I, or interest rate i: F = P + I = P + Pi = P(1 + i) โ€ข Right to P at beginning is exchanged for right to F at end, where F = P(1+i) โ€ข i ๏ƒ  interest rate, P ๏ƒ  present worth of F โ€ข F ๏ƒ  future worth of P, base period ๏ƒ  interest period Copyright ยฉ 2017 Pearson Canada Inc. 2-4 Engineering Economics, Sixth Edition 2.2 Interest and Interest Rates (contโ€™d) โ€ข The dimension of an interest rate is (dollars/dollars)/time. โ€ข i.e. if $1 is lent at a 9% interest rate โ€“ then $0.09/year would be paid in interest per time period โ€ข period over which interest calculated is interest period. CLOSE-UP 2.2 Interest Periods Copyright ยฉ 2017 Pearson Canada Inc. 2-5 Engineering Economics, Sixth Edition 2.3 Compound and Simple Interest 2.3.1 Compound Interest โ€ข If amount P is lent for one period at interest rate, i โ€“ then amount repaid at the end of the period is F = P(1 + i). โ€ข If more than one period, interest is usually compounded โ€“ (i.e. end of each period, interest is added to principal that existed at the beginning of that period) โ€ข The interest accumulated is: F = P(1 + i)N IC = F โˆ’ P = P(1 + i)N โˆ’ P Copyright ยฉ 2017 Pearson Canada Inc. 2-6 Engineering Economics, Sixth Edition Table 2.1 Compound Interest Computations Copyright ยฉ 2017 Pearson Canada Inc. 2-7 Engineering Economics, Sixth Edition Example 2.2 โ€ข With i = 10% per year, how much is owed on a loan of $100 at the end of 3 years? โ€ข What is the compound interest amount? F = P(1 + i)N = 100(1 + 0.10)3 = $133.10 IC = F โˆ’ P = $133.10 โˆ’ $100.00 = $ 33.10 The amount owed is $133.10 The interest owed is $33.10 (See Table 2.2 for yearly accrual) What is the amount owed at each year end? Copyright ยฉ 2017 Pearson Canada Inc. 2-8 Engineering Economics, Sixth Edition 2.3 Compound and Simple Interest (contโ€™d) 2.3.2 Simple Interest Simple Interest โ€“ interest without compounding (interest is not added to principal at end of period) IS = P i N โ€ข Compound and simple interest amounts equal if N = 1. โ€ข As N increases, difference between accumulated interest amounts for the two methods increases exponentially โ€ข The conventional approach for computing interest is the compound interest method โ€ข Simple interest is rarely used Copyright ยฉ 2017 Pearson Canada Inc. 2-9 Engineering Economics, Sixth Edition Figure 2.1 Compound and Simple Interest at 24% Per Year for 20 Years Copyright ยฉ 2017 Pearson Canada Inc. 2 – 10 Engineering Economics, Sixth Edition 2.4 Effective and Nominal Interest Rates โ€ข Interest rates stated for some period, usually a year โ€ข Computation based on shorter compounding sub-periods โ€ข In this section we consider the relation between: โ€“ The nominal interest rate stated for the full period. โ€“ The effective interest rate that results from the compounding based on the subperiods. โ€ข Unless otherwise noted, rates are nominal annual rates โ€ข Suppose: r is nominal rate stated for a period (1 year) consisting of m equal compounding periods (sub-periods) โ€ข If is = r/mโ€ฆ then F = P(1 + iS)m = P(1 + ie) Copyright ยฉ 2017 Pearson Canada Inc. 2 – 11 Engineering Economics, Sixth Edition 2.4 Effective and Nominal Interest (contโ€™d) โ€ข Effective interest rate, ie, gives same future amount, F, over the full period as when sub-period interest rate, iS, is compounded over m sub-periods F = P(1 + iS)m = P(1 + ie) EXAMPLE 2.6 Cardex Credit Card Co. charges a nominal 24 percent interest on overdue accounts, compounded daily. What is the effective interest rate? Since F = P(1 + iS)m = P(1 + ie), ie = (1 + iS)m โˆ’ 1 where is = r/m = 0.24/365 = 0.0006575 then ie = (1 + iS)m โˆ’ 1 = (1 + 0.0006575)365 – 1 = 0.271 โ€ข The effective interest rate is 27.1% Copyright ยฉ 2017 Pearson Canada Inc. 2 – 12 Engineering Economics, Sixth Edition 2.5 Continuous Compounding โ€ข Suppose that the nominal interest rate is 12% and interest is compounded semi-annually โ€ข We compute the effective interest rate as follows: where r = 0.12, m = 2 is = r/m = 0.12/2 = 0.06 ie = (1 + iS)m โˆ’ 1 = (1 + 0.06)2 – 1 = .1236 (12.36%) What if interest were compounded monthly? ie = (1 + iS)m โˆ’ 1 = (1 + 0.01)12 โˆ’ 1 = 0.1268 (12.68%) โ€ข Daily? ie = 0.127475 or about 12.75% โ€ข More than daily? โ€ฆContinuous Compounding Copyright ยฉ 2017 Pearson Canada Inc. 2 – 13 Engineering Economics, Sixth Edition 2.5 Continuous Compounding (contโ€™d) โ€ข The effective interest rate under continuous compounding is: Ie = e r – 1 Copyright ยฉ 2017 Pearson Canada Inc. 2 – 14 Engineering Economics, Sixth Edition 2.5 Continuous Compounding (contโ€™d) โ€ข To compute effective interest rate for nominal interest rate of 12% by continuous compounding: ie = er โˆ’ 1 = e0.12 โˆ’ 1 = 0.12750 = 12.75% โ€ข Continuous compounding makes sense in some situations (i.e large cash flows), but not often used โ€ข Discrete compounding is the norm Copyright ยฉ 2017 Pearson Canada Inc. 2 – 15 Engineering Economics, Sixth Edition 2.6 Cash Flow Diagrams โ€ข Cash flow diagram is a graphical summary of the timing and magnitude of a set of cash flows Copyright ยฉ 2017 Pearson Canada Inc. 2 – 16 Engineering Economics, Sixth Edition Close Up 2.3 Beginning and Ending of Periods Assumptions: Cash flows occur at the ends of periods. End of time period 1 = beginning of time period 2โ€ฆ Time 0 = โ€œnowโ€ Copyright ยฉ 2017 Pearson Canada Inc. 2 – 17 Engineering Economics, Sixth Edition 2.7 Depreciation โ€ข โ€ข โ€ข โ€ข โ€ข Projects involve investment in assets (buildings, equipmentโ€ฆ) that are put to productive use Assets lose value, or depreciate, over time Depreciation taken into account when a firm states the value of its assets in a Financial Statement (Chapter 6) Also part of decision as to when to replace an aging asset as described in Chapter 7 It also impacts taxation as shown in Chapter 8 Copyright ยฉ 2017 Pearson Canada Inc. 2 – 18 Engineering Economics, Sixth Edition 2.7.1 Reasons for Depreciation โ€ข Assets depreciate for a variety of reasons: 1. Use related physical loss: usually measured in units of production, kilometres driven, hours of use 2. Time related physical loss: usually measured in units of time as an unused car will rust and lose value over time 3. Functional loss: usually expressed in terms of function lost including fashion, legislative (i.e. pollution control, safety devices) and technical Copyright ยฉ 2017 Pearson Canada Inc. 2 – 19 Engineering Economics, Sixth Edition 2.7.2 Value of an Asset โ€ข โ€ข โ€ข Depreciation models are used to model (estimate) value of an asset at any point in time. Market Value: value of asset in the open market Book value: value of an asset calculated from a depreciation model for accounting purposes. โ€“ This value may be different from the market value. โ€“ may be several book values given for the same asset (i.e. different for taxation vs. shareholder reports) โ€ข Salvage Value: either actual or estimated value at end of its useful life (when sold) โ€ข Scrap Value: either actual or estimated value at end of life (when broken up for material value) Copyright ยฉ 2017 Pearson Canada Inc. 2 – 20 Engineering Economics, Sixth Edition 2.7.2 Value of an Asset (cont) To state the book value of an asset a good model of depreciation is desirable for the following reasons: 1. To make managerial decisions itโ€™s important to know the value of owned assets (i.e. collateral for a loan) 2. One needs an estimate of the value of assets for planning purposes (i.e. keep an asset or replace) 3. Tax legislation requires company tax to be paid on profits. Rules are legislated on how to calculate income and expenses that includes depreciation Copyright ยฉ 2017 Pearson Canada Inc. 2 – 21 Engineering Economics, Sixth Edition 2.7.2 Value of an Asset (cont) Copyright ยฉ 2017 Pearson Canada Inc. 2 – 22 Engineering Economics, Sixth Edition 2.7.3 Straight-Line Depreciation โ€ข Straight line depreciation (SLD) assumes rate of loss of assetโ€™s value is constant over its useful life. P = purchase price S = salvage value at the end of N periods. N = useful life of asset โ€ข โ€ข โ€ข Advantage: easy to calculate and understand. Disadvantage: most assets do not depreciate at a constant rate. Hence, market values often differ from book values when SLD is used. Copyright ยฉ 2017 Pearson Canada Inc. 2 – 23 Engineering Economics, Sixth Edition Figure 2.7 Book Value Under Straight-Line Depreciation Copyright ยฉ 2017 Pearson Canada Inc. 2 – 24 Engineering Economics, Sixth Edition 2.7.3 Straight-Line Depreciation (contโ€™d) โ€ข Depreciation in period n using SLD: P โˆ’S Dsl (n) = N โ€ข Book Value of the asset at the end of period n: ๏ฃซP โˆ’S ๏ฃถ BVsl ( n ) = P โˆ’ n ๏ฃฌ ๏ฃท N ๏ฃญ ๏ฃธ โ€ข Accumulated Depreciation at the end of period n: ๏ฃซP โˆ’S ๏ฃถ P โˆ’ BV sl ( n ) = n ๏ฃฌ ๏ฃท ๏ฃญ N ๏ฃธ Copyright ยฉ 2017 Pearson Canada Inc. 2 – 25 Engineering Economics, Sixth Edition 2.7.4 Declining-Balance Depreciation โ€ข This DBD method models loss in value of an asset in a period as a constant proportion of the assetโ€™s current value. โ€ข Initial Book Value: BVdb(0) = P โ€ข Book Value at the end of period n using DBD: BVdb (n ) = P (1 โˆ’ d )n โ€ข Depreciation in period n using DBD: Copyright ยฉ 2017 Pearson Canada Inc. Ddb(n) = BVdb(nโˆ’1) d 2 – 26 Engineering Economics, Sixth Edition Figure 2.8 Book Value Under Declining-Balance Depreciation Copyright ยฉ 2017 Pearson Canada Inc. 2 – 27 Engineering Economics, Sixth Edition Example 2.11 Sherbrooke Data Services has purchased a new mass storage system for $250 000. It is expected to last six years, with a $10 000 salvage value. Using both the straight-line and declining-balance methods, determine the following: (a) The depreciation charge in year 1 (b) The depreciation charge in year 6 (c) The book value at the end of year 4 (d) The accumulated depreciation at the end of year 4 โ€ข Ideal application for spreadsheet (see Table 2.3) Copyright ยฉ 2017 Pearson Canada Inc. 2 – 28 Engineering Economics, Sixth Edition Table 2.3 Spreadsheet for Example 2.11 Copyright ยฉ 2017 Pearson Canada Inc. 2 – 29 Engineering Economics, Sixth Edition 2.8 Equivalence โ€ข Engineering Economics utilises โ€œtime value of moneyโ€ to compare certain values at different points in time. โ€ข Three concepts of equivalence are distinguished underlying comparisons of costs/benefits at different times: 1. Mathematical Equivalence 2. Decisional Equivalence 3. Market Equivalence Copyright ยฉ 2017 Pearson Canada Inc. 2 – 30 Engineering Economics, Sixth Edition 2.8 Equivalence (contโ€™d) โ€ข Mathematical Equivalence: Decision-makers exchange P dollars now for F dollars N periods from now using rate i and the mathematical relationship: F = P(1 + i)N โ€ข Decisional Equivalence: Decision-maker is indifferent as to P dollars now or F dollars N periods from now. โ€“ We infer decision-makerโ€™s implied interest rate โ€ข Market Equivalence: Decision-makers exchange different cash flows in a market at zero cost. โ€“ In a financial market, individuals/companies are lending and borrowing money. โ€“ i.e. buying a car and owing $15 000; a lender provides the $15 000 now for $500/month over 36months. Copyright ยฉ 2017 Pearson Canada Inc. 2 – 31 Engineering Economics, Sixth Edition 2.8 Equivalence (contโ€™d) โ€ข For the remainder of this text, we assume: 1. market equivalence holds 2. decisional equivalence can be expressed in monetary terms โ€ข If these two assumptions are reasonably valid, then mathematical equivalence can be used โ€ข Accurate model of costs/benefits relationship Copyright ยฉ 2017 Pearson Canada Inc. 2 – 32 Engineering Economics Financial Decision Making for Engineers Canadian 6th Edition Fraser Solutions Manual Full Download: http://testbanklive.com/download/engineering-economics-financial-decision-making-for-engineers-canadian-6th-edition-fraser-solutions-manual/ Engineering Economics, Sixth Edition Summary โ€ข Notion of Interest and Interest Rates โ€ข Compound and Simple Interest โ€ข Effective and Nominal Interest โ€ข Continuous Compounding โ€ข Representing Cash Flows by Diagrams โ€ข Depreciation and Depreciation Accounting โ€ข โ€ข โ€ข โ€ข Reasons for Depreciation Value of an Asset Straight Line Depreciation Declining Balance Depreciation โ€ข Mathematical, Decisional, Market Equivalence Copyright ยฉ 2017 Pearson Canada Inc. Full download all chapters instantly please go to Solutions Manual, Test Bank site: testbanklive.com 2 – 33

Document Preview (58 of 254 Pages)

User generated content is uploaded by users for the purposes of learning and should be used following SchloarOn's honor code & terms of service.
You are viewing preview pages of the document. Purchase to get full access instantly.

Shop by Category See All


Shopping Cart (0)

Your bag is empty

Don't miss out on great deals! Start shopping or Sign in to view products added.

Shop What's New Sign in