Preview Extract
Chapter 3
3-1
Chapter
Simple Linear Regression
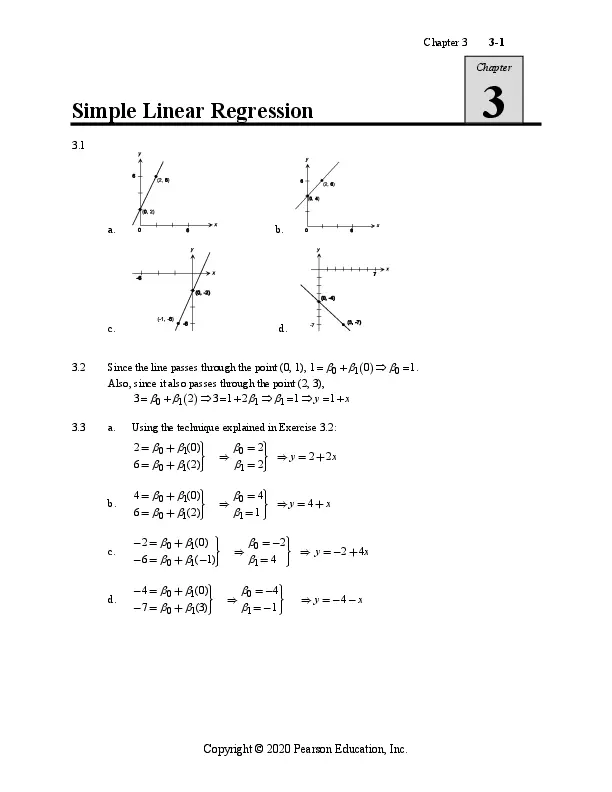
3.1
a.
b.
c.
d.
3.2
Since the line passes through the point (0, 1), 1 ๏ฝ ๏ข 0 ๏ซ ๏ข1 ๏จ 0 ๏ฉ ๏ ๏ข 0 ๏ฝ 1.
Also, since it also passes through the point (2, 3),
3 ๏ฝ ๏ข 0 ๏ซ ๏ข1 ๏จ 2 ๏ฉ ๏ 3 ๏ฝ 1 ๏ซ 2 ๏ข1 ๏ ๏ข1 ๏ฝ 1 ๏ y ๏ฝ 1 ๏ซ x
3.3
a.
Using the technique explained in Exercise 3.2:
รผ
2 = ๏ข 0 + ๏ข1 (0)รฏ
รฏ
รฝ
6 = ๏ข 0 + ๏ข1 (2)รฏ
รฏ
รพ
๏
๏ข 0 = 2รฏรผรฏ
รฝ ๏ y = 2 + 2x
๏ข1 = 2รฏรฏรพ
b.
รผ
4 = ๏ข 0 + ๏ข1 (0)รฏ
รฏ
รฝ
6 = ๏ข 0 + ๏ข1 (2)รฏ
รฏ
รพ
๏
๏ข 0 = 4รฏรผรฏ
รฝ ๏ y = 4+ x
๏ข1 = 1 รฏรฏรพ
c.
รผ
-2 = ๏ข 0 + ๏ข1 (0) รฏ
รฏ
รฝ
-6 = ๏ข 0 + ๏ข1 (-1)รฏ
รฏ
รพ
๏
d.
รผ
-4 = ๏ข 0 + ๏ข1 (0)รฏ
รฏ
รฝ
-7 = ๏ข 0 + ๏ข1 (3)รฏ
รฏ
รพ
๏
๏ข 0 = -2รฏรผรฏ
รฝ ๏ y = -2 + 4x
๏ข1 = 4 รฏรฏรพ
๏ข 0 = -4รฏรผรฏ
รฝ
๏ข1 = -1 รฏรฏรพ
๏ y = -4 – x
Copyright ยฉ 2020 Pearson Education, Inc.
3
3-2
Simple Linear Regression
3.4
a.
b.
c.
d.
e.
3.5
Slope ๏จ ๏ข1 ๏ฉ
y-intercept ๏จ ๏ข0 ๏ฉ
a.
2
3
b.
1
1
c.
3
๏ญ2
d.
5
0
e.
๏ญ2
4
Copyright ยฉ 2020 Pearson Education, Inc.
Chapter 3
3.6
3-3
Some preliminary calculations are:
๏ฅ x ๏ฝ 21
2
๏ฅ x ๏ฝ 91
๏ฅ y ๏ฝ 18
2
๏ฅ y ๏ฝ 68
a.
21
๏ฝ 3.5
6
18
y ๏ฝ ๏ฝ3
6
x๏ฝ
๏ฅ xy ๏ฝ 78
SS xx ๏ฝ ๏ฅ x 2 ๏ญ nx 2 ๏ฝ 91 ๏ญ 6 ๏จ 3.5 ๏ฉ ๏ฝ 17.5
2
SS xy ๏ฝ ๏ฅ xy ๏ญ nxy ๏ฝ 78 ๏ญ 6 ๏จ 3.5 ๏ฉ๏จ 3๏ฉ ๏ฝ 15
SS yy ๏ฝ ๏ฅ y 2 ๏ญ ny 2 ๏ฝ 68 ๏ญ 6 ๏จ 3๏ฉ ๏ฝ 14
2
๏ขห1 ๏ฝ
SS xy
SS xx
๏ฝ
15
๏ฝ 0.8571
17.5
๏ขห0 ๏ฝ y ๏ญ ๏ขห1x ๏ฝ 3 ๏ญ ๏จ 0.8571๏ฉ๏จ 3.5 ๏ฉ ๏ฝ 0
b.
3.7
a.
To compute ๏ขห0 and ๏ขห1 , we first construct the following table:
x
y
x2
xy
y2
๏ญ2
4
๏ญ8
4
16
๏ญ1
0
1
2
3
1
9
3
1
๏ญ3
0
1
๏ญ1
๏ญ2
0
1
4
9
1
1
รฅx=0
รฅ y = 10
รฅ xy = -12
2
รฅ x = 10
2
รฅ y = 36
Then,
2
(รฅ x )
(0)2
= 10
5
n
(รฅ x)(รฅ y )
0(10)
SS xy = รฅ xy = -12 = -12
5
n
2
SS xx = รฅ x –
= 10 –
Copyright ยฉ 2020 Pearson Education, Inc.
3-4
Simple Linear Regression
SS yy = รฅ y 2 y=
2
(รฅ y )
n
2
= 36 –
รฅ y 10
= =2
n
5
(10)
= 16
5
รฅx 0
x=
= =0
n
5
Thus, the least squares estimates of ๏ข 0 and ๏ข1 are:
๏ขห1 =
SS xy
SS xx
=
-12
= -1.2
10
๏ขห0 = y – ๏ขห1x = 2 – (-1.2)(0) = 2
and the equation of the least squares prediction line is yห = 2 -1.2 x.
b.
3.8
3.9
a.
y = ๏ข 0 + ๏ข1x + ๏ฅ
b.
Yes, since the data appears to demonstrate a straight-line relationship.
c.
Sales_Price ๏ฝ 1.4 ๏ซ 1.41 Market_Val
d.
๏ขห0 ๏ฝ 1.4, when x ๏ฝ 0 (no market value), then the sales price has no practical meaning.
e.
Various answers possible. A possible answer for the range on which the slope is
$100,000 < x < $1,000 ,000.
f.
โmean sale priceโ = 1.4 + 1.41๏จ $300,000 ๏ฉ ๏ป $423,000
a.
Yes, there appears to be a positive linear trend. As the height above the horizon increases,
the angular size tends to increase.
b & c. A sketch (answers can vary) of the line with lines drawn to the sketch line is:
Copyright ยฉ 2020 Pearson Education, Inc.
Chapter 3
3-5
Scatterplot of ANGLE vs HEIGHT
327
326
ANGLE
325
324
323
322
10
20
30
40
50
60
70
80
HEIGHT
The estimated deviations and squared deviations are:
ANGLE HEIGHT
321.9
17
322.3
18
322.4
26
323.2
32
323.4
38
324.4
42
325.0
49
325.7
52
325.8
57
325.0
60
326.9
63
326.0
67
325.8
73
Est Fit
322.2
322.3
323.0
323.4
323.9
324.2
324.8
325.0
325.4
325.7
325.9
326.2
326.7
Dev
-0.3
0.0
-0.6
-0.2
-0.5
0.2
0.2
0.7
0.4
-0.7
1.0
-0.2
-0.9
Sq Dev
0.09
0.00
0.36
0.04
0.25
0.04
0.04
0.49
0.16
0.49
1.00
0.04
0.81
3.81
The sum of the squared deviations is 3.81.
d.
From the sketched line, the y-intercept is about 321 and the slope is about 0.1. These are
close to the y-intercept, 320.636, and slope, 0.083, of the regression line.
e.
From the printout, the SSE is 3.56465. The sum of squares from the estimated line is 3.81.
The SSE from the regression line is smaller.
Copyright ยฉ 2020 Pearson Education, Inc.
3-6
Simple Linear Regression
3.10
a.
Using MINITAB, the results are:
Analysis of Variance
Source
DF
Adj SS
Adj MS
F-Value
P-Value
Regression
1
677.45
677.45
24.41
0.003
VO2Max
1
677.45
677.45
24.41
0.003
Error
6
166.55
27.76
Lack-of-Fit
5
142.05
28.41
1.16
0.604
Pure Error
1
24.50
24.50
Total
7
844.00
VIF
Coefficients
Term
Coef
SE Coef
T-Value
P-Value
Constant
-27.2
19.8
-1.38
0.217
VO2Max
0.558
0.113
4.94
0.003
1.00
Regression Equation
HR%
=
-27.2 + 0.558 VO2Max
The least squares line is yห ๏ฝ ๏ญ27.2 ๏ซ 0.558 x.
b.
Since 0 is not in the range of observed values of VO2Max, the y-intercept does not have a
practical interpretation.
c.
๏ขห1 ๏ฝ 0.558 For each unit increase in the value of VO2Max, the mean HR% is estimated to
increase by 0.558.
3.11
3.12
a.
No, there does not appear to any trend for cooperation use versus the average payoff.
b.
No, there does not appear to any trend for defective use versus the average payoff.
c.
Yes, there appears to be somewhat of a linear relationship for average payoff and
punishment use.
d.
Negative relationship; the more punishment use, the average payoff decreases.
e.
Yes, winners tend to punish less than non-winners.
a.
Using MINITAB, some calculations are:
Analysis of Variance
Source
DF
Adj SS
Adj MS
F-Value
P-Value
Regression
1
6083.84
6083.84
26.35
0.000
Year
1
6083.84
6083.84
26.35
0.000
Error
10
2309.07
230.91
Lack-of-Fit
9
2301.07
255.67
31.96
0.136
Pure Error
1
8.00
8.00
Total
11
8392.92
Copyright ยฉ 2020 Pearson Education, Inc.
Chapter 3
3-7
Model Summary
S
R-sq
R-sq(adj)
R-sq(pred)
15.1956
72.49%
69.74%
54.61%
Coefficients
Term
Coef
SE Coef
T-Value
P-Value
Constant
-3675
724
-5.08
0.000
Year
1.870
0.364
5.13
0.000
VIF
1.00
Regression Equation
Cost
=
-3675 + 1.870 Year
The least squares line is yห ๏ฝ ๏ญ3675 ๏ซ 1.870 x.
b.
Since 0 is not in the range of observed values of Year, the y-intercept does not have a
practical interpretation.
c.
๏ขห1 ๏ฝ 1.87 For each unit increase in cost, the mean cost is estimated to increase by 1.87
million dollars.
3.13
a.
Some preliminary calculations are:
n = 24
รฅ x = 6167
รฅ y = 135.8
2
รฅ x = 1,641,115
2
รฅ y = 769.72
SS xy = รฅ xy –
2
SS xy
SS xx
=
n
= 34,765 –
2
SS xx = รฅ x –
๏ขห1 =
(รฅ x)(รฅ y )
(รฅ x )
n
รฅ xy = 34,765
(6167)(135.8)
24
= -129.94167
2
= 164,115 –
(6167)
24
= 56, 452.958
-129.94167
= -0.002301769 @ -0.0023
56, 452.958
๏ขห0 = y – ๏ขห1 x =
รฆ 6167 รถรท
135.8
– (-0.002301769)รงรง
= 6.249792065 @ 6.251
รงรจ 24 รธรทรท
24
The least squares line is yห = 6.25 – 0.0023x.
b.
๏ขห 0 = 6.25 Since x = 0 is not in the observed range, ๏ขห0 has no interpretation other than
being the y-intercept.
๏ขห1 = -0.0023. For each additional increase of 1 part per million of pectin, the mean
sweetness index is estimated to decrease by 0.0023.
Copyright ยฉ 2020 Pearson Education, Inc.
3-8
3.14
Simple Linear Regression
c.
yห = 6.25 – 0.0023(300) = 5.56.
a.
Using MINITAB, some preliminary results are:
Analysis of Variance
Source
DF
Adj SS
Adj MS
F-Value
P-Value
Regression
1
9.08
9.080
0.18
0.676
CDIFF
1
9.08
9.080
0.18
0.676
Error
22
1116.78
50.763
Lack-of-Fit
21
1026.06
48.860
0.54
0.813
Pure Error
1
90.72
90.720
Total
23
1125.86
VIF
Coefficients
Term
Coef
SE Coef
T-Value
P-Value
Constant
49.57
1.56
31.76
0.000
CDIFF
0.0275
0.0650
0.42
0.676
1.00
Regression Equation
VSHARE
=
49.57 + 0.0275 CDIFF
The least squares line is yห ๏ฝ 49.57 ๏ซ 0.0275 x.
b.
Using MINITAB, the scatterplot is:
Fitted Line Plot
VSHARE = 49.57 + 0.02748 CDIFF
65
S
R-Sq
R-Sq(adj)
7.12481
0.8%
0.0%
60
VSHARE
55
50
45
40
35
-75
-50
-25
0
25
50
CDIFF
There does not appear to be much of a linear relationship between Democratic vote share
and charisma difference. There might be a slight positive linear trend.
c.
๏ขห1 ๏ฝ 0.0275 For each unit increase in charisma difference, the mean Democratic vote share
is estimated to increase by 0.0275 points.
3.15
Some preliminary calculations are:
y=
รฅ x 103.07
=
= 0.71576
n
144
x=
รฅ y 792
=
= 5.5
n
144
Copyright ยฉ 2020 Pearson Education, Inc.
Chapter 3
SS xy = รฅ xy SS xx = รฅ x –
๏ขห1 =
SS xy
SS xx
792(103.07)
รฅ xรฅ y
= 586.86 = 19.975
n
144
2
2
=
3-9
(รฅ x )
= 5,112 –
n
7922
= 756
144
19.975
= 0.026421957
756
๏ขหo = y – ๏ขห1 x =
รฆ 792 รถรท
103.07
– (0.026421957) รงรง
= 0.570443121
รงรจ 144 รทรทรธ
144
The estimated regression line is yห = 0.5704 + 0.0264 x. Since x = 0 is nonsensical, no practical
interpretation of ๏ขห = 0.5704. For each one-position increase in order, estimated recall proportion
0
increases by ๏ขห = 0.0264.
1
The scatterplot in this problem clearly shows a significantly nonlinear trend. Therefore, the linear
model is not the best to describe the data in this scatter plot.
Scatterplot of Mass vs Time
7
6
5
4
Mass
3.16
3
2
1
0
0
10
20
30
40
50
60
Time
Analysis of Variance
Source
DF
Adj SS
Adj MS
F-Value
P-Value
Regression
1
89.79
89.7942
122.19
0.000
Time
1
89.79
89.7942
122.19
0.000
Error
21
15.43
0.7349
Total
22
105.23
Coefficients
Term
Coef
SE Coef
T-Value
P-Value
Constant
5.221
0.296
17.64
0.000
-0.1140
0.0103
-11.05
0.000
Time
VIF
1.00
Regression Equation
Mass
=
5.221 – 0.1140 Time
Copyright ยฉ 2020 Pearson Education, Inc.
3-10
Simple Linear Regression
The fitted regression line is yห = 5.221 – 0.1140 x. Since the coefficient of time is negative, there
is evidence that the mass of the spill tends to decrease as time increases. For each minute
increase in time, the mean mass is estimated to diminish by 5.221 pounds.
a.
Using MINITAB, the scatterplot of the data is:
Scatterplot of AACC vs AAFEMA
0.7
0.6
0.5
AACC
3.17
0.4
0.3
0.2
0.1
0.0
0
5
10
15
20
25
30
AAFEMA
There does not appear to be any apparent trend in the plot.
b.
Using MINITAB, the results are:
Analysis of Variance
Source
DF
Adj SS
Adj MS
F-Value
P-Value
Regression
1
0.06200
0.06200
2.79
0.102
AAFEMA
1
0.06200
0.06200
2.79
0.102
Error
48
1.06817
0.02225
Lack-of-Fit
36
0.92617
0.02573
2.17
0.075
Pure Error
12
0.14200
0.01183
Total
49
1.13016
VIF
Coefficients
Term
Coef
SE Coef
T-Value
P-Value
Constant
0.2489
0.0292
8.52
0.000
AAFEMA
0.00542
0.00324
1.67
0.102
1.00
Regression Equation
AACC
=
0.2489 + 0.00542 AAFEMA
The least squares line is yห ๏ฝ 0.2489 ๏ซ 0.00542 x.
The estimated y-intercept is ๏ขห0 ๏ฝ 0.2489 and the estimated slope is ๏ขห1 ๏ฝ 0.00542.
c.
๏ขห0 ๏ฝ 0.2489 Since 0 is not in the observed range of the average annual FEMA relief, the yintercept has no practical interpretation.
๏ขห1 ๏ฝ 0.00542 For each unit increase in the average annual FEMA relief, the mean average
annual number of public corruption convictions is estimated to increase by 0.00542 per
100,000 residents.
Copyright ยฉ 2020 Pearson Education, Inc.
Chapter 3
3.18
3.19
SSE
0.219
=
= 0.0313
n-2 9-2
a.
s2 =
b.
s = 0.0313 = 0.1769
a.
Using data from Exercise 3.6,
SSE ๏ฝ SS ๏ญ ๏ขห SS ๏ฝ 14 ๏ญ 0.8751๏จ15 ๏ฉ ๏ฝ 1.1435
yy
s2 ๏ฝ
b.
1
xy
SSE 1.1435
๏ฝ
๏ฝ 0.2859
n๏ญ2
6๏ญ2
s ๏ฝ 0.2856 ๏ฝ 0.5347
Using data from Exercise 3.7,
SSE ๏ฝ SS ๏ญ ๏ขห SS ๏ฝ 16 ๏ญ ๏จ ๏ญ1.2 ๏ฉ๏จ ๏ญ12 ๏ฉ ๏ฝ 1.6
yy
3.20
3-11
1
xy
s2 ๏ฝ
SSE
1.6
๏ฝ
๏ฝ 0.5333
n๏ญ2 5๏ญ2
s ๏ฝ 0.5333 ๏ฝ 0.7303
a.
s2 ๏ฝ
SSE
1.04
๏ฝ
๏ฝ 0.04
n ๏ญ 2 28 ๏ญ 2
s ๏ฝ 0.04 ๏ฝ 0.2
b.
We would expect most of the observed value to fall within 2s or 2 ๏จ 0.2 ๏ฉ ๏ฝ 0.4 units of the
least squares line.
3.21
3.22
3.23
a.
y = ๏ข 0 + ๏ข1 x + ๏ฅ
b.
The least squares line is yห = 120 + 0.3456 x.
c.
Assumption 1: The mean of the probability distribution of ๏ฅ is 0.
Assumption 2: The variance of the probability distribution of ๏ฅ is constant for all settings of
the independent variable x.
Assumption 3: The probability distribution of ๏ฅ is normal.
Assumption 4: The errors associated with any two different observations are independent.
d.
s = 635.187
e.
yห ๏ฑ 2s ๏ yห ๏ฑ 2(635.187) ๏ yห ๏ฑ 1270.374
a.
From Exercise 3.12, s ๏ฝ 15.1956.
b.
We would expect most of the observed values to fall within 2s or 2 ๏จ15.1956 ๏ฉ ๏ฝ 30.3912 units
of the least squares line.
a.
Using calculations from Exercise 3.13,
Copyright ยฉ 2020 Pearson Education, Inc.
3-12
Simple Linear Regression
SS yy = รฅ y 2 –
2
(รฅ y )
n
2
= 769.72 –
(135.8)
24
= 1.318333
SSE ๏ฝ SS yy ๏ญ ๏ขห1SS xy ๏ฝ 1.318333 ๏ญ ๏จ ๏ญ0.002301769 ๏ฉ๏จ ๏ญ129.94167 ๏ฉ ๏ฝ 1.01924
s2 ๏ฝ
3.24
SSE 1.01924
๏ฝ
๏ฝ 0.0463
n๏ญ2
24 ๏ญ 2
s ๏ฝ 0.0463 ๏ฝ 0.2152
b.
The units of measure for s 2 are square units. It is very difficult to interpret units such as
dollars squared, minutes squared, etc.
c.
We would expect most of the observed values to fall within 2s or 2 ๏จ 0.2152 ๏ฉ ๏ฝ 0.4304 units
of the least squares line.
a.
The estimate of ๏ณ 2 is s 2 ๏ฝ
b.
The estimate of ๏ณ is s ๏ฝ 0.02225 ๏ฝ 0.1492.
c.
The estimate of ๏ณ can be interpreted practically because it is measured in the same units as
SSE 1.06817
๏ฝ
๏ฝ 0.02225.
n๏ญ2
50 ๏ญ 2
the data. The units of measure of ๏ณ 2 are square units.
d.
We would expect most of the observed values to fall within 2s or 2 ๏จ 0.1492 ๏ฉ ๏ฝ 0.2984 units
of the least squares line. In this problem, the units of measure is dollars per capita.
However, looking at the scatterplot, the data do not fall close to a straight line. The model
will not be very accurate in predicting a stateโs average annual number of public corruption
convictions.
3.25
3.26
a.
The least squares line with the steepest slope is with the pair AB Magnitude Alert and AB
Magnitude No-Tone.
b.
The least squares line that produces the largest SSE is with the pair AB Magnitude Alert and
AB Magnitude No-Tone.
c.
The least squares line that produces the smallest estimate of ๏ณ is with the pair AB
Magnitude Sim and AB Magnitude Alert.
a.
To determine if ๏ข1 differs from 0, we test:
H 0 : ๏ข1 = 0
H a : ๏ข1 ยน 0
Copyright ยฉ 2020 Pearson Education, Inc.
Chapter 3
The test statistic is t =
๏ขห1
s
SS xx
=
3-13
0.8571
= 6.71
0.5345 17.5
The rejection region requires ๏ก / 2 = 0.05 / 2 = 0.025 in each tail of the t distribution. From
Table 2, Appendix D, with df = n – 2 = 6 – 2 = 4 , t 0.025 = 2.776 . The rejection region is
t 2.776.
Since the observed value of the test statistic falls in the rejection region (t = 6.71 > 2.776),
H0 is rejected. There is sufficient evidence to indicate that x contributes information for the
prediction of y using a linear model at ๏ก = .05.
b.
To determine if ๏ข1 differs from 0, we test:
H 0 : ๏ข1 = 0
H a : ๏ข1 ยน 0
The test statistic is t =
๏ขห1
s
SS xx
=
-1.2
= -5.20
0.7303 10
The rejection region requires ๏ก / 2 = 0.05 / 2 = 0.025 in each tail of the t distribution. From
Table 2, Appendix D, with df = n – 2 = 5 – 2 = 3 , t 0.025 = 3.182 . The rejection region is
t 3.182.
Since the observed value of the test statistic falls in the rejection
region (t = -5.20 0
From the printout, the test statistic is t ๏ฝ 38.132 and the p-value is p ๏ฝ 0.000 / 2 ๏ฝ 0.000.
Since the p-value is less than ๏ก ๏จ p ๏ฝ 0.000 ๏ผ 0.01๏ฉ , H0 is rejected. There is sufficient
evidence to indicate there is a positive linear relationship between appraised property value
and sale price at ๏ก ๏ฝ 0.01.
b.
From the printout, the 95% confidence interval is ๏จ1.335,1.482 ๏ฉ . We are 95% confident that
for each $1000 increase in market value, the mean sale price is estimated to increase by
from $1,335 to $1,482.
Copyright ยฉ 2020 Pearson Education, Inc.
3-14
Simple Linear Regression
c.
3.28
In order to obtain a narrower confidence interval, one could lower the confidence level (i.e.
to 90%) or increase the sample size.
Some preliminary calculations are:
SS yy = รฅ y 2 –
2
(รฅ y )
n
2
= 769.72 –
(135.8)
24
= 1.3183333
SSE = SS yy – ๏ขห1SS xy = 1.3183333 – (-0.002301796)(-129.94167) = 1.019237592
s2 =
SSE 1.019237592
=
= 0.046329
n-2
22
s๏ขห =
1
s2
0.046329
=
= 0.000906
SS xx
56452.958
For confidence level 0.90, ๏ก = 0.10 and ๏ก / 2 = 0.10 / 2 = 0.05. From Table 2, Appendix D with
df = n – 2 = 24 – 2 = 22, t 0.05 = 1.717.
The confidence interval is:
๏ขห1 ๏ฑ t 0.05 s๏ขห ๏ -0.0023 ๏ฑ 1.717 (0.000906) ๏ (-0.0039, -0.0008)
1
We are 90% confident that the change in the mean sweetness index for each one unit change in
the pectin is between ๏ญ0.0039 and ๏ญ0.0007.
3.29
a.
The equation for the simple linear regression is y = ๏ข 0 + ๏ข1 x + ๏ฅ .
b.
The value of ๏ข 0 is probably irrelevant. By definition, ๏ข 0 is the mean value of entitlement
score for those whose helicopter parent score is 0. We would expect ๏ข1 to be positive. As
the helicopter parent score increases, the entitlement score increases.
c.
Since the p-value is less than ๏ก ๏จ p ๏ฝ 0.002 ๏ผ 0.01๏ฉ , H0 is rejected. There is sufficient
evidence to indicate there is a positive linear relationship between entitlement scores and
helicopter parent score at ๏ก ๏ฝ 0.01.
3.30
For confidence level 0.95, ๏ก = 0.05 and ๏ก / 2 = 0.05 / 2 = 0.025. From Table 2, Appendix D with
df = n – 2 = 50 – 2 = 48, t 0.025 ยป 2.021. The confidence interval is:
๏ขห1 ๏ฑ t 0.025 s๏ขห ๏ 0.00542 ๏ฑ 2.021(0.00324) ๏ (-0.0011,0.0120)
1
We are 95% confident that the increase in the mean stateโs average annual number of public
corruption convictions is between -0.0011 and 0.0120 for each unit increase in the stateโs average
annual FEMA relief.
Copyright ยฉ 2020 Pearson Education, Inc.
Chapter 3
3.31
3-15
a.
The equation for the simple linear regression is y = ๏ข 0 + ๏ข1 x + ๏ฅ .
b.
The y-intercept does not have any meaning because 0 cannot be in the range of observed
beauty index.
c.
For each unit increase in the beauty index, the mean relative success is estimated to increase
by 22.91 points.
d.
To determine if the slope of the line is positive, we test:
H 0 : ๏ข1 = 0
H a : ๏ข1 > 0
The test statistic is t =
๏ขห1
s๏ขห
1
=
22.91
= 6.14.
3.73
The rejection region requires ๏ก ๏ฝ 0.01 in the upper tail of the t distribution. From Table 2,
Appendix D, with df ๏ฝ n ๏ญ 2 ๏ฝ 641 ๏ญ 2 ๏ฝ 639, t0.01 ๏ฝ 2.326. The rejection region
is t ๏พ 2.326.
Since the observed value of the test statistic falls in the rejection region ๏จ t ๏ฝ 6.14 ๏พ 2.326 ๏ฉ ,
H0 is rejected. There is sufficient evidence to indicate the slope of the line is positive
at ๏ก ๏ฝ 0.01. There is evidence to indicate that as the beauty index increases, the relative
success also increases.
3.32
To determine if the simple linear regression model is useful for predicting Democratic vote share,
we test:
H 0 : ๏ข1 = 0
H a : ๏ข1 ยน 0
The test statistic is t =
๏ขห1
s๏ขห
1
=
0.0275
= 0.42 and the p-value is p ๏ฝ 0.676. (From Exercise 3.14)
0.0650
Since the p-value is not less than ๏ก ๏จ p ๏ฝ 0.676 ๏ผ๏ฏ 0.10 ๏ฉ , H0 is not rejected. There is insufficient
evidence to indicate the simple linear regression model is useful for predicting Democratic vote
share at ๏ก ๏ฝ 0.10.
3.33
Using the calculations from Exercise 3.15 and these calculations:
SS yy = รฅ y 2 –
2
(รฅ y )
n
= 83.474 –
103.07 2
= 9.70021597
144
Copyright ยฉ 2020 Pearson Education, Inc.
3-16
Simple Linear Regression
SSE = SS yy – ๏ขห1 ( SS xy ) = 9.70021597 – (0.026421957)(19.975) = 9.172437366
s2 =
SSE
9.172437366
=
= 0.064594629
n-2
144 – 2
s = s 2 = 0.064594629 = 0.254154735
To determine if there is a linear trend between the proportion of names recalled and position, we
test:
H 0 : ๏ข1 ๏ฝ 0
H a : ๏ข1 ๏น 0
The test statistic is t =
๏ขห1 – 0
s๏ขห
=
1
๏ขห1
s
SS xx
=
0.02642 – 0
0.25415
756
= 2.86
The rejection region requires ๏ก / 2 = 0.01 / 2 = 0.005 in each tail of the t distribution. From Table
2, Appendix D, with df = n – 2 = 144 – 2 = 142, t0.005 ยป 2.576. The rejection region is
t 2.576. .
Since the observed test statistic falls in the rejection region (t = 2.86 > 2.576), H0 is rejected.
There is sufficient evidence to indicate the proportion of names recalled is linearly related to
position at ๏ก = .01.
3.34
a.
To determine if the spill mass tends to diminish linearly as time increases, we test:
H 0 : ๏ข1 ๏ฝ 0
H a : ๏ข1 ๏ผ 0
Using information from Exercise 3.16, the test statistic is t ๏ฝ ๏ญ11.05 and the p-value
is p ๏ฝ 0.000 / 2 ๏ฝ 0.000. Since the p-value is less than ๏ก ๏จ p ๏ฝ 0.000 ๏ผ 0.05 ๏ฉ , H0 is rejected.
There is sufficient evidence to indicate the spill mass tends to diminish linearly as time
increases at ๏ก ๏ฝ 0.05.
b.
Using MINTAB, the 95% confidence intervals are:
Fits and Diagnostics for All Observations
Obs
Time
Mass
Fit
SE Fit
95% CI
1
0
6.640
5.221
0.296
(4.605, 5.836)
2
1
6.340
5.107
0.288
(4.508, 5.705)
3
2
6.040
4.993
0.280
(4.411, 5.575)
4
4
5.470
4.765
0.264
(4.215, 5.314)
5
6
4.940
4.537
0.249
(4.018, 5.055)
6
8
4.440
4.309
0.236
(3.819, 4.798)
7
10
3.980
4.080
0.223
(3.617, 4.544)
8
12
3.550
3.852
0.211
(3.414, 4.291)
9
14
3.150
3.624
0.201
(3.207, 4.042)
10
16
2.790
3.396
0.192
(2.996, 3.796)
11
18
2.450
3.168
0.186
(2.782, 3.554)
Copyright ยฉ 2020 Pearson Education, Inc.
Chapter 3
3.36
20
2.140
2.940
0.181
(2.563, 3.317)
13
22
1.860
2.712
0.179
(2.340, 3.084)
14
24
1.600
2.484
0.179
(2.112, 2.857)
15
26
1.370
2.256
0.182
(1.878, 2.634)
16
28
1.170
2.028
0.186
(1.640, 2.416)
17
30
0.980
1.800
0.193
(1.398, 2.202)
18
35
0.600
1.230
0.218
(0.776, 1.684)
19
40
0.340
0.660
0.251
(0.137, 1.182)
20
45
0.170
0.090
0.290
(-0.513, 0.693)
21
50
0.060
-0.480
0.332
(-1.171, 0.210)
22
55
0.020
-1.051
0.377
(-1.834, -0.267)
23
60
0.000
-1.621
0.423
(-2.500, -0.742)
a.
For each 1% increase in the ln(body mass), the mean ln(eye mass) is estimated to increase
by anywhere from 0.25 to 0.30.
b.
For each 1% increase in the ln(body mass), the mean ln(orbit axis angle) is estimated to
decrease by anywhere from 0.14 to 0.50.
a.
๏ขห0 = 0.5151
๏ขห1 = 0.000021
b. To determine if there is a positive linear relationship between elevation and slugging
percentage, we test:
H 0 : ๏ข1 ๏ฝ 0
H a : ๏ข1 ๏พ 0
From the printout, the test statistic is t = 2.89 and the p-value is p = 0.008 / 2 = 0.004. Since
the p-value is less than ๏ก ๏จ p ๏ฝ 0.004 ๏ผ 0.01๏ฉ , H0 is rejected. There is sufficient evidence to
indicate there is a positive linear relationship between elevation and slugging percentage
at ๏ก ๏ฝ 0.01.
c.
Using MINITAB, the scatterplot is:
Scatterplot of SLUGPCT vs ELEVATION
0.625
0.600
0.575
SLUGPCT
3.35
12
3-17
0.550
0.525
0.500
0.475
0.450
0
1000
2000
3000
4000
5000
6000
ELEVATION
Copyright ยฉ 2020 Pearson Education, Inc.
Simple Linear Regression
Denverโs elevation is much greater than all the others. In addition, if the observation for
Denver is deleted, there does not appear to be much of a relationship between elevation and
slugging percentage.
d.
Using MINITAB, the results are:
Analysis of Variance
Source
DF
Adj SS
Adj MS
F-Value
P-Value
Regression
1
0.001389
0.001389
0.98
0.332
ELEVATION
1
0.001389
0.001389
0.98
0.332
Error
26
0.036922
0.001420
Lack-of-Fit
22
0.036685
0.001667
28.08
0.003
Pure Error
4
0.000238
0.000059
Total
27
0.038311
Coefficients
Term
Coef
SE Coef
T-Value
P-Value
Constant
0.5154
0.0107
48.33
0.000
ELEVATION
0.000020
0.000020
0.99
0.332
VIF
1.00
Regression Equation
SLUGPCT
=
0.5154 + 0.000020 ELEVATION
๏ขห0 = 0.5154
๏ขห1 = 0.000020
To determine if there is a positive linear relationship between elevation and slugging
percentage, we test:
H 0 : ๏ข1 ๏ฝ 0
H a : ๏ข1 ๏พ 0
From the printout, the test statistic is t = 0.99 and the p-value is p = 0.332 / 2 = 0.166. Since
the p-value is not less than ๏ก ๏จ p ๏ฝ 0.166 ๏ผ๏ฏ 0.01๏ฉ , H0 is not rejected. There is insufficient
evidence to indicate there is a positive linear relationship between elevation and slugging
percentage at ๏ก ๏ฝ 0.01.
The new plot is:
Scatterplot of SLUGPCT vs ELEVATION
0.625
0.600
0.575
SLUGPCT
3-18
0.550
0.525
0.500
0.475
0.450
0
200
400
600
800
1000
1200
ELEVATION
Copyright ยฉ 2020 Pearson Education, Inc.
Chapter 3
3.37
3.38
3.39
3-19
a.
Years of education and yearly income
b.
Number of hours playing video games and GPA
a.
If r ๏ฝ 0.7, , there is a positive linear relationship between x and y. As x increases, y tends to
increase. The slope is positive.
b.
If r ๏ฝ ๏ญ0.7, there is a negative linear relationship between x and y. As x increases, y tends to
decrease. The slope is negative.
c.
If r ๏ฝ 0, , there is a 0 slope. There is no linear relationship between x and y.
d.
If r 2 ๏ฝ 0.64, then r is either 0.8 or ๏ญ๏ฐ.8. The linear relationship between x and y could be
either positive or negative.
a.
From Exercise 3.6, SS xx = 17.5, SS yy = 14 and SS xy = 15
r๏ฝ
SS xy
SS xx SS yy
15
๏ฝ
๏จ17.5๏ฉ๏จ14๏ฉ
๏ฝ 0.9583
From Exercise 3.19, SSE = 1.1435
SS yy – SSE 14 -1.1435
=
= 0.9183.
r2 =
14
SS yy
There is a strong positive correlation between x and y.
We can explain 91.83% of the variation in the sample yโs using the linear model with x.
b.
In Exercise 3.7, SS xx = 10, SS yy = 16 and SS xy = -12
r=
SS xy
SS xx SS yy
=
-12
10(16)
= -0.9487.
In Exercise 3.7, SSE ๏ฝ SS yy ๏ญ ๏ขห1SS xy ๏ฝ 16 ๏ญ ๏จ๏ญ1.2๏ฉ๏จ ๏ญ12๏ฉ ๏ฝ 1.6.
r2 =
SS yy – SSE
SS yy
=
16 -1.6
= 0.90.
16
There is a strong positive linear correlation between x and y.
We can explain 90% of the variation in the sample yโs using the linear model with x.
3.40
We would expect the crime rate to increase as U.S. population increases. Therefore, we expect a
positive correlation between the variables.
3.41
We would expect the GPA of a college student to be correlated to his/her I.Q. As the I.Q. score
increases, we would expect the GPA to increase. Thus, the correlation would be positive.
Copyright ยฉ 2020 Pearson Education, Inc.
3-20
Simple Linear Regression
3.42
a.
r ๏ฝ 0.975. There is a very strong linear relationship between the sale price of a house and
the appraised property market value.
b.
r 2 ๏ฝ 0.9516. 95.16% of the sample home sale prices is explained by the linear relationship
between the appraised value of the house and the final market price.
a.
r 2 ๏ฝ 0.18. 18% of the sample number of points scored is explained by the linear
relationship between the number of points scored and the number of yards from the
opposing goal line.
b.
r ๏ฝ ๏ญ 0.18 ๏ฝ ๏ญ0.424. The value of r is negative because the coefficient associated with the
number of yards from the opposing goal line in the fitted regression line is negative.
a.
Since the p-value of 0.33 is greater than ๏ก ๏ฝ 0.05, we cannot conclude that there is a
significant linear relationship between cooperation use and average payoff.
b.
Since the p-value of 0.66 is greater than ๏ก ๏ฝ 0.05, we cannot conclude that there is a
significant linear relationship between defection use and average payoff.
c.
Since the p-value of 0.001 is smaller than ๏ก ๏ฝ 0.05, we can conclude that there is a
significant linear relationship between punishment use and average payoff.
a.
Since the p-value of 0.07 is greater than ๏ก ๏ฝ 0.05, we cannot conclude that there is a
significant linear relationship between baseline and follow-up physical activity for obese
young adults; fail to reject H 0 : ๏ฒ = 0 at ๏ก ๏ฝ .05.
b.
A possible scatterplot of the data would be:
3.44
3.45
Scatterplot of Follow-up vs Baseline
70
60
Follow-up
3.43
50
40
30
20
55.0
57.5
60.0
62.5
65.0
67.5
Baseline
2
c.
r 2 = (.50) = 0.25, thus 25% of the variability around the sample mean for the total of
follow-up number of movements is explained by the linear relationship between the
baseline total number of movements for the obese adults and the follow-up total number of
movements for the obese adults.
d.
Since the correlation value itself is close to zero and the p-value of 0.66 is greater than
๏ก ๏ฝ 0.05, we cannot conclude that there is a significant linear relationship between baseline
Copyright ยฉ 2020 Pearson Education, Inc.
Chapter 3
3-21
and follow-up physical activity for normal weight young adults; fail to reject H 0 : ๏ฒ = 0 at
๏ก ๏ฝ .05.
e.
A possible scatterplot is:
Scatterplot of Follow-up vs Baseline
60
Follow-up
50
40
30
20
10
10
20
30
40
50
Baseline
f.
3.46
2
r 2 = (-.12) = 0.0144. Thus 1.44% of the variability around the sample mean for the total
of follow-up number of movements is explained by the linear relationship between the
baseline total number of movements for the normal weight young adults and the total of
follow-up number of movements for the normal weight young adults.
In Exercise 3.13, SS xx = 56, 452.958 and SS xy = -129.94167
2
SS yy ๏ฝ ๏ฅ y ๏ญ
r=
๏จ ๏ฅ y ๏ฉ2
SS xy
SS xx SS yy
n
=
๏ฝ 769.72 ๏ญ
135.82
๏ฝ 1.318333
24
-129.94167
56, 452.958(1.318333)
= -0.4763.
SSE ๏ฝ SS yy ๏ญ ๏ขห1SS xy ๏ฝ 1.318333 ๏ญ ๏จ ๏ญ0.002301769๏ฉ๏จ ๏ญ129.94167 ๏ฉ ๏ฝ 1.01924.
r2 =
SS yy – SSE
SS yy
=
1.318333 -1.01924
= 0.2269.
1.318333
22.69% of the variability around the sample mean for the sweetness index can be explained by
the linear relationship between the sweetness index and the amount of water-soluble pectin.
3.47
a.
There is a rather weak negative linear relationship between the numerical value of a last
name and the response time.
b.
Since the p-value is less than ๏ก ๏จ p ๏ฝ 0.018 ๏ผ 0.05 ๏ฉ , H0 is rejected. There is sufficient
evidence to indicate a negative linear relationship between the numerical value of a last
name and the response time.
c.
Yes, the analysis supports the researchersโ last name effect theory. Because the correlation
coefficient is negative, as the numerical value of the last name increases, the response time
tends to decrease.
Copyright ยฉ 2020 Pearson Education, Inc.
3-22
Simple Linear Regression
3.48
Using the values computed in Exercise 3.15:
SS xy
19.975
=
= 0.2333
r=
SS xx SS yy
756(9.70031597)
Because r is fairly close to 0, there is a very weak positive linear relationship between the
proportion of names recalled and position.
r 2 = 0.23332 = 0.0544
5.44% of the sample variance of proportion of names recalled around the sample mean is
explained by the linear relationship between proportion of names recalled and position.
3.49
a.
To determine if the true population correlation coefficient relating NRMSE and bias is
positive, we test:
H0 : ๏ฒ = 0
Ha : ๏ฒ > 0
The test statistic is t ๏ฝ
r
1๏ญ r2
n๏ญ2
๏ฝ
0.2838
1 ๏ญ 0.28382
3,600 ๏ญ 2
๏ฝ 17.753.
No ๏ก value was given, so we will use ๏ก ๏ฝ 0.5. The rejection region requires ๏ก ๏ฝ 0.5 in the
upper tail of the t distribution. From Table 2, Appendix D, with
df ๏ฝ n ๏ญ 2 ๏ฝ 3,600 ๏ญ 2 ๏ฝ 3598, t0.05 ๏ฝ 1.645. The rejection region is t ๏พ 1.645.
Since the observed value of the test statistic falls in the rejection region ๏จ t ๏ฝ 17.753 ๏พ 1.645 ๏ฉ ,
H0 is rejected. There is sufficient evidence to indicate the true population correlation
coefficient relating NRMSE and bias is positive at ๏ก ๏ฝ 0.5.
3.50
b.
No, we would not recommend using NRMSE as a linear predictor of bias. The estimated
correlation coefficient is r ๏ฝ 0.2838. This indicates that there is a rather weak positive linear
relationship between NRMSE and bias. The sample size was extremely large. The larger
the sample size, the easier it is to find statistical significance. In this case, there is statistical
significance, but not practical significance.
a.
The sample correlation coefficient between PSI and PHI-F is r ๏ฝ 0.401. There is a weak
positive linear relationship between the perceived sensory intensity and the perceived
hedonic intensity for favorite food.
The sample correlation coefficient between PSI and PHI-L is r ๏ฝ ๏ญ0.375. There is a weak
negative linear relationship between the perceived sensory intensity and the perceived
hedonic intensity for least favorite food.
b.
Yes, we agree that those with the greatest taste intensity tend to experience more extreme
food likes and dislikes. As the taste intensity increases, the intensity of favorite foods tends
to increase. As the taste intensity increases, the intensity of least favorite foods tends to
decrease.
Copyright ยฉ 2020 Pearson Education, Inc.
Chapter 3
3.51
3.52
3-23
a.
r 2 ๏ฝ 0.948. 94.8% of the variability around the mean ln(eye mass) is explained by the
linear relationship between ln(eye mass) and ln(body mass).
b.
From 3.35a, the relationship between ln (eye mass) and ln (body mass) is positive.
Therefore, r ๏ฝ 0.948 ๏ฝ 0.974. There is a very strong positive linear relationship between
ln (eye mass) and ln (body mass).
c.
r 2 ๏ฝ .375. 37.5% of the variability around the mean ln(orbit axis angle) is explained by the
linear relationship between ln(orbit axis angle) and ln(body mass).
d.
From 3.35b, the relationship between ln(orbit axis angle) and ln(body mass) is negative.
Therefore, r ๏ฝ ๏ญ 0.375 ๏ฝ ๏ญ0.612. There is a moderate negative linear relationship between
ln(orbit axis angle) and ln(body mass).
a.
First, examine the formulas for the confidence interval and the prediction interval. The only
difference is that the prediction interval has an extra term (a “1”) beneath the radical. Thus,
the prediction interval must be wider:
๏จ
xp ๏ญ x
1
๏ซ
n
SS xx
๏ฉ ๏ผ 1๏ซ 1 ๏ซ ๏จ xp ๏ญ x ๏ฉ
2
n
2
SS xx
The error in estimating the mean value of y, E ๏จ y ๏ฉ , for a given value of x, say xp, is the
distance between the least squares line, yห ๏ฝ ๏ขห ๏ซ ๏ขห x, and the true line of means,
0
1
๏จ
๏ฉ
E ๏จ y ๏ฉ ๏ฝ ๏ข 0 ๏ซ ๏ข1 x. In contrast, the error in predicting some future of y, yห ๏ญ y p is the sum of
two errors: the error of estimating the mean of y, E ๏จ y ๏ฉ , plus the random error of the actual
values of y around its mean. Consequently, the error of predicting a particular value of y
will be larger than the error of estimating the mean value of y for a particular value of x.
b.
๏จ x p ๏ญ x ๏ฉ , the further x is from x , the larger the
Since the standard error contains the term
a.
๏ขห1 =
2
3.53
p
SS xx
standard error. This causes the confidence intervals to be wider for values of xp further from
x . The implication is our best confidence intervals (narrowest) will be found when x p ๏ฝ x .
SS xy
SS xx
=
16.22
= 3.400
4.77
SSE = SS yy – ๏ขห1SS xy = 59.21 – 3.4(16.22) = 4.062
s2 =
b.
SSE
4.062
=
= 0.226.
n – 2 20 – 2
For x = 2.5, yห = 2.1 + 3.4 (2.5) = 10.6
Copyright ยฉ 2020 Pearson Education, Inc.
3-24
Simple Linear Regression
2
1 (x – x )
+
.
The form of the 95% confidence interval is yห ๏ฑ t๏ก /2 s
n
SS xx
For confidence coefficient 0.95, ๏ก = 0.05 and ๏ก / 2 = 0.05 / 2 = 0.025. From Table 2,
Appendix D, with df = n – 2 = 20 – 2 = 18, t0.025 = 2.101.
The 95% confidence interval is:
1 ๏จ2.5 ๏ญ 2.5๏ฉ
10.6 ๏ฑ 2.101 0.226
๏ซ
๏ 10.6 ๏ฑ 0.223 ๏ ๏จ10.377,10.823๏ฉ
20
4.77
2
We are 95% confident the mean value of y when x = 2.5 is between 10.377 and 10.823.
c.
For x = 2.0, yห = 2.1 + 3.4(2.0) = 8.9.
The 95% confidence interval is:
1 ๏จ2.0 ๏ญ 2.5๏ฉ
8.9 ๏ฑ 2.101 0.226
๏ซ
๏ 8.9 ๏ฑ 0.320 ๏ ๏จ8.580, 9.220๏ฉ
20
4.77
2
We are 95% confident the mean value of y when x = 2.0 is between 8.580 and 9.220.
d.
For x = 3.0, yห = 2.1 + 3.4(3.0) = 12.3.
The 95% confidence interval is:
1 ๏จ3.0 ๏ญ 2.5๏ฉ
๏ซ
๏ 12.3 ๏ฑ 0.320 ๏ ๏จ11.980,12.620๏ฉ
20
4.77
2
12.3 ๏ฑ 2.101 0.226
We are 95% confident the mean value of y when x = 3.0 is between 11.980 and 12.620.
e.
The width of the interval in (b) is10.823 ๏ญ 10.377 ๏ฝ 0.446.
The width of the interval in (c) is 9.220 ๏ญ 8.580 ๏ฝ 0.640.
The width of the interval in (d) is 12.620 ๏ญ 11.980 ๏ฝ 0.640.
As the value of x moves away from x ๏ฝ 2.5, the confidence interval gets wider.
f.
The 95% prediction interval is yห ๏ฑ t๏ก /2 s 1 +
1 ( x – x )2
.
+
n
SS xx
2
1 (3.0 – 2.5)
๏ 12.3 ๏ฑ 1.049 ๏ (11.251,13.349).
12.3 ๏ฑ 2.101 0.226 1 + +
20
4.77
We are 95% confident that the actual value of y will be between 11.251 and 13.349 when
the value of x is 3.
Copyright ยฉ 2020 Pearson Education, Inc.
Chapter 3
3.54
3.55
a.
No. We know there is a significant linear relationship between sale price and
appraised value. However, the actual sale prices may be scattered quite far from the
predicted line.
b.
From the printout, the 95% prediction interval for the actual sale price when the
appraised value is $300,000 is ๏จ 285.938, 561.741๏ฉ or ๏จ $285,938, $561,741๏ฉ . We are 95%
confident that the actual sale price for a home appraised at $300,000 is between
$285,938 and $561,741.
c.
From the printout, the 95% confidence interval for the mean sale price when the
appraised value is $300,000 is ๏จ 408.119, 439.560 ๏ฉ or ๏จ $408,119, $439,560 ๏ฉ . We are 95%
confident that the mean sale price for a home appraised at $300,000 is between
$408,119 and $439,560.
a.
Researchers should use a prediction interval for y with
๏จ
xp ๏ญ x
1
x = 10 ๏ yห ๏ฑ t๏ก /2 s 1 ๏ซ ๏ซ
n
SS xx
b.
๏ฉ ๏ yห ๏ฑ t s 1 ๏ซ 1 ๏ซ ๏จ10 ๏ญ x ๏ฉ .
2
2
๏ก /2
n
SS xx
Researchers should use a confidence interval for the mean value of y or E ๏จ y ๏ฉ , with
๏จ
xp ๏ญ x
1
x ๏ฝ 10 ๏ yห ๏ฑ t๏ก /2 s
๏ซ
n
SS xx
3.56
3-25
๏ฉ ๏ yห ๏ฑ t s 1 ๏ซ ๏จ10 ๏ญ x ๏ฉ .
2
2
๏ก /2
n
SS xx
a.
We are 95% confident that the actual value of the angular size of the Moon is between
323.502 and 326.108 when the height above the horizon is 50 degrees.
b.
We are 95% confident that the mean value of the angular size of the Moon is between
324.448 and 325.163 when the height above the horizon is 50 degrees.
c.
No, we would not recommend using the least squares line to predict the angular size of the
Moon for a height of 80 degrees because 80 degrees is outside the observed range of data
used to construct the least squares line.
3.57
For x = 300, the confidence interval for E ( y ) is (5.45812, 5.65964). We are 90% confident that
the mean sweetness index is between 5.458 and 5.660 when the amount of pectin is 300.
3.58
a.
From Exercises 3.15 and 3.33, x ๏ฝ 5.5, SS xx ๏ฝ 756, s ๏ฝ 0.25415, and yห ๏ฝ 0.5704 ๏ซ 0.0264 x.
For x ๏ฝ 5, yห ๏ฝ 0.5704 ๏ซ 0.0264 ๏จ 5 ๏ฉ ๏ฝ 0.7024.
For confidence coefficient 0.99, ๏ก ๏ฝ 0.01 and ๏ก / 2 ๏ฝ 0.01 / 2 ๏ฝ 0.005. From Table 2,
Appendix D, with df ๏ฝ n ๏ญ 2 ๏ฝ 144 ๏ญ 2 ๏ฝ 142, t0.005 ๏ป 2.576. The 99% confidence interval is:
๏จ
xp ๏ญ x
1
yห ๏ฑ t๏ก /2 s
๏ซ
n
SS xx
๏ฉ ๏ 0.7024 ๏ฑ 2.576 ๏จ0.2542๏ฉ
2
๏จ5 ๏ญ 5.5๏ฉ
1
๏ซ
144
756
Copyright ยฉ 2020 Pearson Education, Inc.
2
3-26
Simple Linear Regression
๏ 0.7024 ๏ฑ 0.0559 ๏ ๏จ0.6465, 0.7583๏ฉ
We are 99% confident that the mean recall of all those in the 5th position is between
0.6465 and 0.7583.
b.
For confidence coefficient 0.99, ๏ก ๏ฝ 0.01 and ๏ก / 2 ๏ฝ 0.01 / 2 ๏ฝ 0.005. From Table 2,
Appendix D, with df ๏ฝ n ๏ญ 2 ๏ฝ 144 ๏ญ 2 ๏ฝ 142, t0.005 ๏ป 2.576. The 99% prediction interval is:
๏จ
xp ๏ญ x
1
yห ๏ฑ t๏ก /2 s 1 ๏ซ ๏ซ
n
SS xx
๏ฉ ๏ 0.7024 ๏ฑ 2.576 ๏จ0.2542๏ฉ 1 ๏ซ 1 ๏ซ ๏จ5 ๏ญ 5.5๏ฉ
2
144
2
756
๏ 0.7024 ๏ฑ 0.6572 ๏ ๏จ0.0452, 1.3596๏ฉ
We are 99% confident that the actual recall of a person in the 5th position is between 0.0452
and 1.3596. Since the proportion of names recalled cannot be larger than 1, the actual
proportion recalled will be between 0.0452 and 1.000.
3.59
c.
The prediction interval in part b is wider than the confidence interval in part a. The
prediction interval will always be wider than the confidence interval. The confidence
interval for the mean is an interval for predicting the mean of all observations for a particular
value of x. The prediction interval is a confidence interval for the actual value of the
dependent variable for a particular value of x.
a.
From Exercises 3.16 and 3.34, x = 22.87, SS xx ๏ฝ 6906.608, s = 0.8573, and
yห = 5.22 – 0.114 x.
For x = 15, yห = 5.22 – 0.114(15) = 3.51.
For confidence coefficient 0.90, ๏ก = 0.10 and ๏ก = 0.10 / 2 = 0.05. From Table 2,
Appendix D, with df ๏ฝ n ๏ญ 2 ๏ฝ 23 ๏ญ 2 ๏ฝ 21, t0.05 ๏ฝ 1.721. The 90% confidence interval is:
๏จ
xp ๏ญ x
1
yห ๏ฑ t๏ก /2 s
๏ซ
n
SS xx
๏ฉ ๏ 3.51 ๏ฑ 1.721๏จ0.8573๏ฉ 1 ๏ซ ๏จ15 ๏ญ 22.87๏ฉ ๏
2
2
23
6906.608
3.51 ๏ฑ 0.34 ๏ ๏จ3.17, 3.85๏ฉ.
We are 90% confident that the mean mass of all spills with an elapsed time of 15 minutes is
between 3.17 and 3.85.
b.
For confidence coefficient 0.90, ๏ก = 0.10 and ๏ก / 2 = 0.10 / 2 = 0.05. From Table 2,
Appendix D, with df ๏ฝ n ๏ญ 2 ๏ฝ 23 ๏ญ 2 ๏ฝ 21, t0.05 ๏ฝ 1.721. The 90% prediction interval is:
๏จ
๏ฉ
๏ถ 2
2
xp ๏ญ x
1
1 ๏จ15 ๏ญ 22.87 ๏ฉ
หy ๏ฑ t๏ก /2 s 1 ๏ซ ๏ซ
๏ 3.51 ๏ฑ 1.721๏จ0.8573๏ฉ 1 ๏ซ
๏ซ
๏
n
SS xx
23
6906.608
3.51 ๏ฑ 1.514 ๏ ๏จ2.00, 5.02๏ฉ.
We are 90% confident that the mass of a single spill with an elapsed time of 15 minutes is
between 2.00 and 5.02.
Copyright ยฉ 2020 Pearson Education, Inc.
Chapter 3
3.60
a.
3-27
To determine if the model is adequate for predicting nitrogen amount, we test:
H 0 : ๏ข1 = 0
H a : ๏ข1 ยน 0
The test statistic is t = 32.80 and the p-value is p < 0.0001.
Since the p-value is so small ( p 1.980), H0 is rejected. There is sufficient evidence to there is a linear
relationship between the monthly price of recycled colored plastic bottles and the
monthly price of naphtha at ๏ก = 0.05.
r 2 = 0.69 69% of the sample variation around the mean monthly price of recycled
colored plastic bottles is explained by the linear relationship between the monthly
price of recycled colored plastic bottles and the monthly price of naphtha.
Copyright ยฉ 2020 Pearson Education, Inc.
Chapter 3
3.63
a.
3-29
Using MINITAB, the results are:
Regression Analysis: Corrupt versus GDP
Analysis of Variance
Source
DF
Adj SS
Adj MS
F-Value
P-Value
Regression
1
3345.8
3345.76
45.33
0.000
Error
11
811.9
73.81
Total
12
4157.7
Model Summary
S
R-sq
R-sq(adj)
8.59141
80.47%
78.70%
Coefficients
Term
Coef
SE Coef
T-Value
P-Value
Constant
25.89
3.09
8.37
0.000
0.000985
0.000146
6.73
0.000
GDP
Regression Equation
Corrupt
=
25.89 + 0.000985 GDP
The fitted regression line is yห = 25.89 + 0.000985GPD.
To determine if GDP per capita is a linear predictor of corruption level, we test:
H 0 : ๏ข1 = 0
H a : ๏ข1 ยน 0
The test statistic is t = 6.73 and the p-value is p = 0.000. Since the p-value is so small, H0 is
rejected. There is sufficient evidence to indicate GDP per capita is a linear predictor of
corruption level for any reasonable value of ๏ก .
r 2 ๏ฝ 0.8047 This indicates that 80.47% of the variability in the corruption values is
explained by the linear relationship between the corruption values and the GDP per capita.
b.
Using MINITAB, the results are:
Regression Analysis: Corrupt versus PolR
Analysis of Variance
Source
DF
Adj SS
Adj MS
F-Value
P-Value
Regression
1
2528
2527.6
17.06
0.002
Error
11
1630
148.2
Total
12
4158
Model Summary
S
R-sq
R-sq(adj)
12.1732
60.79%
57.23%
Copyright ยฉ 2020 Pearson Education, Inc.
3-30
Simple Linear Regression
Coefficients
Term
Coef
SE Coef
T-Value
P-Value
Constant
66.06
7.34
9.00
0.000
PolR
-6.25
1.51
-4.13
0.002
Regression Equation
Corrupt
=
66.06 – 6.25 PolR
The fitted regression line is yห = 66.06 – 6.25PolR.
To determine if degree of freedom in political rights is a linear predictor of corruption level,
we test:
H 0 : ๏ข1 = 0
H a : ๏ข1 ยน 0
The test statistic is t = -4.13 and the p-value is p = 0.002. Since the p-value is so small, H0
is rejected. There is sufficient evidence to indicate GDP per capita is a linear predictor of
corruption level for any value of ๏ก > 0.002.
r 2 ๏ฝ 0.6079 This indicates that 60.79% of the variability in the corruption values is
explained by the linear relationship between the corruption values and the degree of freedom
in political rights.
c.
Using MINITAB, a scatterplot of the data is:
Scatterplot of MTBE vs pH
50
40
30
MTBE
3.64
Both variables, GDP per capita and degree of freedom in political rights, are significant
predictors of corruption levels. Of the two, GDP per capita is a better predictor because the
r 2 value is larger and the p-value for the test is smaller.
20
10
0
5
6
7
8
9
10
pH
From the plot, there does not look like there is a linear relationship between MTBE and pH level.
The proposed linear regression model is y ๏ฝ ๏ข 0 ๏ซ ๏ข1 x ๏ซ ๏ฅ . Using MINITAB, an analysis of the
data is:
Copyright ยฉ 2020 Pearson Education, Inc.
Chapter 3
3-31
Analysis of Variance
Source
DF
Adj SS
Adj MS
F-Value
P-Value
Regression
1
2.01
2.008
0.08
0.782
Error
221
5785.93
26.181
Total
222
5787.94
Model Summary
S
R-sq
R-sq(adj)
R-sq(pred)
5.11670
0.03%
0.00%
0.00%
Coefficients
Term
Coef
SE Coef
T-Value
P-Value
Constant
0.35
3.14
0.11
0.911
pH
0.116
0.420
0.28
0.782
VIF
1.00
The parameter estimates of the least squares line are: ๏ขห0 ๏ฝ 0.35
The least squares line is yห ๏ฝ 0.35 ๏ซ 0.116 x.
๏ขห1 ๏ฝ 0.116
The least squares estimate of the slope, ๏ขห1 ๏ฝ 0.116, implies that the estimated MTBE increases
by 0.116 for each additional unit increase in the pH level. This interpretation is valid only over
the observed values of the pH level which is from 5.28 to 9.48. The estimated y-intercept,
๏ขห0 ๏ฝ 0.35 has no practical meaning in this example because 0 will not be within the observed
range of the pH levels.
The estimate of ๏ณ is s ๏ฝ 5.1167 . The value of this estimate is very large compared to most of the
values of MTBE.
To determine if there is a linear relationship between the MTBE and the pH level, we test:
H 0 : ๏ข1 = 0
H a : ๏ข1 ยน 0
The test statistic is t = 0.28 and the p-value is p = 0.782. Since the p-value is so large, H0 will not
be rejected for any reasonable value of ๏ก . There is insufficient evidence to indicate there is a
linear relationship between the MTBE and the pH level.
r 2 ๏ฝ 0.00 This indicates that 0% of the variability in the MTBE values is explained by the linear
relationship between the MTBE values and the pH levels. This would indicate that a linear
regression model does not explain the relationship between MTBE and pH.
Copyright ยฉ 2020 Pearson Education, Inc.
3-32
Simple Linear Regression
3.65
Using MINITAB, a scatter plot of the data is:
Scatterplot of HEATRATE vs RPM
17000
16000
15000
HEATRATE
14000
13000
12000
11000
10000
9000
8000
0
5000
10000
15000
20000
25000
30000
35000
RPM
From the plot, there is evidence to indicate a linear relationship between heat rate and speed.
The proposed linear regression model is y ๏ฝ ๏ข 0 ๏ซ ๏ข1 x ๏ซ ๏ฅ . Using MINITAB, an analysis of the
data is:
Analysis of Variance
Source
DF
Adj SS
Adj MS
F-Value
P-Value
Regression
1
119598530
119598530
160.95
0.000
RPM
1
119598530
119598530
160.95
0.000
Error
65
48298678
743057
Lack-of-Fit
28
28773369
1027620
1.95
0.029
Pure Error
37
19525309
527711
Total
66
167897208
Model Summary
S
R-sq
R-sq(adj)
R-sq(pred)
862.007
71.23%
70.79%
69.63%
Coefficients
Term
Coef
SE Coef
T-Value
P-Value
Constant
9470
164
57.73
0.000
0.1917
0.0151
12.69
0.000
RPM
VIF
1.00
Regression Equation
HEATRATE
=
9470 + 0.1917 RPM
The parameter estimates of the least squares line are: ๏ขห0 ๏ฝ 9470
The least squares line is yห ๏ฝ 9470 ๏ซ 0.1917 x.
๏ขห1 ๏ฝ 0.1917
The least squares estimate of the slope, ๏ขห1 ๏ฝ 0.1917, implies that the estimated heat rate increases
by 0.1917 units for each additional unit increase in the speed. This interpretation is valid only
over the observed values of the speed level which is from 3,000 to 33,000. The estimated
y-intercept, ๏ขห0 ๏ฝ 9470 has no practical meaning in this example because 0 will not be within the
observed range of the speed levels.
Copyright ยฉ 2020 Pearson Education, Inc.
Chapter 3
3-33
The estimate of ๏ณ is s ๏ฝ 862.007 . We expect most of the observations to fall within
2s ๏ฝ 2 ๏จ 862.007 ๏ฉ ๏ฝ 1724.014 units of their predicted values.
To determine if there is a linear relationship between the heat rate and the speed, we test:
H 0 : ๏ข1 = 0
H a : ๏ข1 ยน 0
The test statistic is t = 12.69 and the p-value is p = 0.000. Since the p-value is so small, H0 will
be rejected for any reasonable value of ๏ก . There is sufficient evidence to indicate there is a linear
relationship between the heat rate and speed.
r 2 ๏ฝ 0.7173 This indicates that 71.73% of the variability in the heat rate values is explained by
the linear relationship between heat rate and the speed. This indicates that a linear regression line
models the relationship between heat rate and speed fairly well.
Using MINITAB, a scatterplot of the data is:
Scatterplot of ACCURACY vs DISTANCE
75
70
65
ACCURACY
3.66
60
55
50
45
280
290
300
310
320
DISTANCE
From the plot, there is evidence to indicate a linear relationship between accuracy and distance.
The proposed linear regression model is y ๏ฝ ๏ข 0 ๏ซ ๏ข1 x ๏ซ ๏ฅ . Using MINITAB, an analysis of the
data is:
Analysis of Variance
Source
DF
Adj SS
Adj MS
F-Value
P-Value
Regression
1
874.99
874.989
174.95
0.000
DISTANCE
1
874.99
874.989
174.95
0.000
Error
38
190.06
5.001
Lack-of-Fit
36
176.55
4.904
0.73
0.735
Pure Error
2
13.51
6.753
Total
39
1065.04
Model Summary
S
R-sq
R-sq(adj)
R-sq(pred)
2.23639
82.16%
81.69%
79.26%
Copyright ยฉ 2020 Pearson Education, Inc.
3-34
Simple Linear Regression
Coefficients
Term
Coef
SE Coef
T-Value
P-Value
Constant
250.1
14.2
17.58
0.000
DISTANCE
-0.6294
0.0476
-13.23
0.000
VIF
1.00
Regression Equation
ACCURACY
=
250.1 – 0.6294 DISTANCE
The parameter estimates of the least squares line are: ๏ขห0 ๏ฝ 250.1
The least squares line is yห ๏ฝ 250.1 ๏ญ 0.6294 x.
๏ขห1 ๏ฝ ๏ญ0.6294
The least squares estimate of the slope, ๏ขห1 ๏ฝ ๏ญ0.6294, implies that the estimated accuracy
decreases by 0.6294 units for each additional yard increase in distance. This interpretation is
valid only over the observed values of distance which is from 293.2 to 318.9 yards. The
estimated y-intercept, ๏ขห0 ๏ฝ 250.1 has no practical meaning in this example because 0 will not be
within the observed range of distances.
The estimate of ๏ณ is s ๏ฝ 2.23639 . We expect most of the observations to fall within
2s ๏ฝ 2 ๏จ 2.23639 ๏ฉ ๏ฝ 4.473 units of their predicted values.
To determine if there is a negative linear relationship between accuracy and distance, we test:
H 0 : ๏ข1 = 0
H a : ๏ข1 0
The test statistic is t ๏ฝ
s
๏ขห1
๏ฅx
๏ฝ
2
3.158333
๏ฝ 43.193
1.1328
240
The rejection region requires ๏ก ๏ฝ 0.05 in the upper tail of the t distribution. From Table 2,
Appendix D, with df ๏ฝ n ๏ญ 1 ๏ฝ 8 ๏ญ 1 ๏ฝ 7, t0.05 ๏ฝ 1.895. The rejection region is t ๏พ 1.895.
Since the observed value of the test statistic falls in the rejection region ๏จ t ๏ฝ 43.193 ๏พ 1.895 ๏ฉ ,
H0 is rejected. There is sufficient evidence to indicate that x and y are positively linearly
related at ๏ก ๏ฝ 0.05.
d.
๏ฆ s ๏ถ
๏ท.
The form of the confidence interval for ๏ข1 is ๏ขห1 ๏ฑ t0.025 ๏ง
๏ง ๏ฅ x2 ๏ท
๏จ
๏ธ
Copyright ยฉ 2020 Pearson Education, Inc.
Chapter 3
3-37
For confidence coefficient 0.95, ๏ก ๏ฝ 0.05 and ๏ก / 2 ๏ฝ 0.05 / 2 ๏ฝ 0.025. From Table 2,
Appendix D, with df ๏ฝ n ๏ญ 1 ๏ฝ 8 ๏ญ 1 ๏ฝ 7, t0.025 ๏ฝ 2.365. The 95% confidence interval is:
๏ฆ
๏ถ
๏ท ๏ 3.158 ๏ฑ 2.365 ๏ง๏ฆ 1.1328 ๏ท๏ถ ๏ 3.158 ๏ฑ 0.173 ๏ ๏จ 2.985, 3.331๏ฉ
๏ง ๏ฅ x2 ๏ท
๏จ 240 ๏ธ
๏จ
๏ธ
๏ขห1 ๏ฑ t0.025 ๏ง
e.
s
The point estimate for y when x ๏ฝ 7 is yห ๏ฝ 3.158 ๏จ 7 ๏ฉ ๏ฝ 22.106. The 95% confidence interval
for E ๏จ y ๏ฉ is:
๏ฆ x2 ๏ถ
๏ฆ 72 ๏ถ
p ๏ท
๏ง
๏ท ๏ 22.106 ๏ฑ 1.211 ๏ ๏จ 20.895, 23.317 ๏ฉ
๏
๏ฑ
yห ๏ฑ t0.025 s ๏ง
22.106
2.365
1.1328
๏จ
๏ฉ
๏ง๏ง ๏ฅ x 2 ๏ท๏ท
๏ง 240 ๏ท
๏จ
๏ธ
๏จ
๏ธ
f.
The 95% prediction interval for y is:
๏ฆ
2 ๏ถ
๏ฆ
x 2p ๏ถ๏ท
๏ง 1๏ซ 7 ๏ท
22.106
2.365
1.1328
yห ๏ฑ t0.025 s ๏ง 1 ๏ซ
๏
๏ฑ
๏จ
๏ฉ
2
๏ง๏ง
๏ง
240 ๏ท
๏ฅ x ๏ท๏ท
๏จ
๏ธ
๏จ
๏ธ
๏ 22.106 ๏ฑ 2.940 ๏ ๏จ19.166, 25.046 ๏ฉ
3.69
a.
The results of the preliminary calculations are provided below:
n = 5, รฅ x 2 = 30, รฅ xy = -278, รฅ y 2 = 2589
Substituting into the formula for ๏ขห1 , we have ๏ขห1 =
รฅ xy
รฅx
2
=
-278
= -9.2667 and the least
30
squares line is yห = -9.2667 x.
b.
SSE = รฅ y 2 – ๏ขห1 รฅ xy = 2589 – (-9.26666677)(-278) = 12.8667
s2 =
c.
SSE 12.8667
=
= 3.2167 s = s 2 = 3.2167 = 1.7935
n -1
5 -1
To determine if x and y are negatively linearly related, we test:
H 0 : ๏ข1 = 0
H a : ๏ข1 0
The test statistic is t =
๏ขห1
=
s
รฅx
2
0.2085
= 52.29.
1.5869
158, 400
The rejection region requires ๏ก ๏ฝ 0.05 in the upper tail of the t distribution. From Table 2,
Appendix D, with df ๏ฝ n ๏ญ 1 ๏ฝ 10 ๏ญ 1 ๏ฝ 9, t0.05 ๏ฝ 1.833. The rejection region is t ๏พ 1.833.
Since the observed value of the test statistic falls in the rejection region ๏จ t ๏ฝ 52.29 ๏พ 1.833๏ฉ ,
H0 is rejected. There is sufficient evidence to indicate that x and y are positively linearly
related at ๏ก ๏ฝ 0.05.
d.
๏ฆ s ๏ถ
๏ท.
The form of the confidence interval for ๏ข1 is ๏ขห1 ๏ฑ t0.025 ๏ง
๏ง ๏ฅ x2 ๏ท
๏จ
๏ธ
For confidence coefficient 0.95, ๏ก ๏ฝ 0.05 and ๏ก / 2 ๏ฝ 0.05 / 2 ๏ฝ 0.025. From Table 2,
Appendix D, with df ๏ฝ n ๏ญ 1 ๏ฝ 10 ๏ญ 1 ๏ฝ 9, t0.025 ๏ฝ 2.262. The 95% confidence interval is:
รฆ
รง
รถรท
รฆ 1.5869 รถรท
รทรท ๏ 0.2085 ๏ฑ 0.0090 ๏ (0.1995, 0.2175).
รทรทรท ๏ 0.2085 ๏ฑ 2.262รงรงรง
รงรจ รฅ x 2 รทรทรธ
รจรง 158, 400 รธรท
๏ขห1 ๏ฑ t0.025 รงรงรง
e.
s
The point estimate for y when x ๏ฝ 125 is yห ๏ฝ ๏ขห1 x ๏ฝ 0.2085 ๏จ125 ๏ฉ ๏ฝ 26.06. The 95% confidence
interval for E ๏จ y ๏ฉ is:
รฆ
รถ
รฆ
2 รถรท
รงรง x 2p รทรท
รทรท ๏ 26.06 ๏ฑ 2.262(1.5869)รงรงรง 125 รทรท ๏ 26.06 ๏ฑ 1.13
yห ๏ฑ t0.025 s รงรง
รท
2รท
รง
รงรจ 158, 400 รทรทรธ
รงรจรง รฅ x รทรธรท
๏ (24.93, 27.19).
f.
The 95% prediction interval for y is:
๏ฆ
2 ๏ถ
๏ฆ
x 2p ๏ถ๏ท
๏ง 1 ๏ซ 125 ๏ท
๏
๏ฑ
26.06
2.262
1.5869
yห ๏ฑ t0.025 s ๏ง 1 ๏ซ
๏จ
๏ฉ
2
๏ง๏ง
๏ง
158, 400 ๏ท
๏ฅ x ๏ท๏ท
๏จ
๏ธ
๏จ
๏ธ
๏ 26.06 ๏ฑ 3.76 ๏ ๏จ 22.30, 29.82 ๏ฉ
3.71
a.
Some preliminary calculations are:
n=8
2
รฅ x = 59.75
รฅ xy = 320.5
2
รฅ y = 1738
Copyright ยฉ 2020 Pearson Education, Inc.
3-40
Simple Linear Regression
รฅ xy 320.5
=
= 5.364016736 ยป 5.364, and the least squares line is yห = 5.364 x.
Then, ๏ขห1 =
2
59.75
รฅx
b.
To determine if there is a linear relationship between drug dosage and decrease in pulse rate,
we test:
H 0 : ๏ข1 ๏ฝ 0
H a : ๏ข1 ๏น 0
๏ขห1
The test statistic is t =
s
รฅx
where s = s 2 =
2
2
1738 – (5.364)(320.5)
SSE
รฅ y – ๏ขห1 รฅ xy
=
=
= 1.640
8 -1
n -1
n -1
Substituting, we have t =
5.364
= 25.28.
1.640
59.75
The rejection region requires ๏ก / 2 ๏ฝ 0.10 / 2 ๏ฝ 0.05 in each tail of the t distribution. From
Table 2, Appendix D, with df ๏ฝ n ๏ญ 1 ๏ฝ 8 ๏ญ 1 ๏ฝ 7, t0.05 ๏ฝ 1.895. The rejection region
is t ๏ผ ๏ญ1.895 or t ๏พ 1.895.
Since the observed value of the test statistic falls in the rejection region ๏จ t ๏ฝ 25.28 ๏พ 1.895 ๏ฉ ,
H0 is rejected. There is sufficient evidence to indicate that drug dosage and decrease in
pulse rate are linearly related at ๏ก ๏ฝ 0.10.
c.
We want to predict the decrease in pulse rate y corresponding to a drug dosage of x p = 3.5
cubic centimeters. First, we obtain the point estimate:
yห = ๏ขห1 x = 5.364(3.5) = 18.774
For confidence coefficient 0.99, ๏ก ๏ฝ 0.01 and ๏ก / 2 ๏ฝ 0.01 / 2 ๏ฝ 0.005. From Table 2,
Appendix D, with df ๏ฝ n ๏ญ 1 ๏ฝ 8 ๏ญ 1 ๏ฝ 7, t0.005 ๏ฝ 3.499. The 99% confidence interval is:
yห ๏ฑ t0.005 s 1 +
x 2p
รฅx
๏ 18.774 ๏ฑ 3.499 (1.640) 1 +
2
(3.5)2
๏ 18.774 ๏ฑ 6.299
59.75
๏ (12.475, 25.073).
Therefore, we predict the decrease in pulse rate corresponding to a dosage of 3.5cc to fall
between 12.475 and 25.073 beats/minute with 99% confidence.
Copyright ยฉ 2020 Pearson Education, Inc.
Chapter 3
Some preliminary calculations are:
2
รฅ y = 3,571, 211, 200 รฅ xy = 76,652,695
2
รฅ x = 4305 รฅ x = 1,652,025 รฅ y = 201,558
a.
๏ขห1 =
รฅ xy
2
=
76,652,695
= 46.39923427 ยป 46.3992, and the least squares line is
1,652,025
รฅx
yห = 46.3992 x.
Using MINITAB, the scatterplot of the data with the fitted line is:
30000
yhat=46.4x
25000
20000
WEIGHT
3.72
3-41
yhat=478.4+45.15x
15000
10000
5000
0
0
100
200
300
400
500
600
BAGS
b.
2
SSxx ๏ฝ ๏ฅ x ๏ญ
๏จ ๏ฅ x ๏ฉ2
๏จ 4305๏ฉ2
๏ฝ 1,652,025 ๏ญ
๏ฝ 416, 490
n
15
๏จ ๏ฅ x ๏ฉ๏จ ๏ฅ y ๏ฉ
๏จ 4305๏ฉ๏จ 201,558๏ฉ
SS xy ๏ฝ ๏ฅ xy ๏ญ
๏ฝ 76,652,695 ๏ญ
๏ฝ 18,805,549
n
15
๏ขห1 ๏ฝ
SS xy
SS xx
๏ฝ
18,805,549
๏ฝ 45.15246224 ๏ป 45.152
416, 490
๏ขห0 ๏ฝ y ๏ญ ๏ขห1 x ๏ฝ
201,558
๏ฆ 4305 ๏ถ
๏ญ 45.1524622 ๏ง
๏ท ๏ฝ 478.443
15
๏จ 15 ๏ธ
The fitted line is yห ๏ฝ 478.443 ๏ซ 45.152 x.
c.
Since 0 is not contained in the observed range of values of the number of 50-pound bags in
the shipment, ๏ขฬ 0 has no practical interpretation. Therefore, a value of ๏ขฬ 0 that differs from 0
is not unexpected.
d.
First, we need to compute s.
SS yy ๏ฝ ๏ฅ y 2 ๏ญ
๏จ ๏ฅ y ๏ฉ2
n
๏ฝ 3,571, 211, 200 ๏ญ
๏จ 201,558 ๏ฉ2
15
๏ฝ 862,836,042
SSE ๏ฝ SS yy ๏ญ ๏ขห1SS xy ๏ฝ 862,836,042 ๏ญ 45.15246224 ๏จ18,805,549 ๏ฉ ๏ฝ 13,719, 200.9
Copyright ยฉ 2020 Pearson Education, Inc.
3-42
Simple Linear Regression
s2 ๏ฝ
SSE 13,719, 200.9
๏ฝ
๏ฝ 1,055,323.146
n๏ญ2
15 ๏ญ 2
s ๏ฝ 1,055,323.146 ๏ฝ 1027.2892
To determine if ๏ข 0 should be included in the model, we test:
H0 : ๏ข0 ๏ฝ 0
H a : ๏ข0 ๏น 0
The test statistic is t ๏ฝ
๏ขห0
1
x2
s
๏ซ
n SS xx
๏ฝ
478.4
1
287 2
1027.289
๏ซ
15 416, 490
๏ฝ 0.906.
The rejection region requires ๏ก / 2 ๏ฝ 0.10 / 2 ๏ฝ 0.05 in each tail of the t distribution. From
Table 2, Appendix D, with df ๏ฝ n ๏ญ 2 ๏ฝ 15 ๏ญ 2 ๏ฝ 13, t0.05 ๏ฝ 1.771. The rejection region
is t ๏ผ ๏ญ1.771 or t ๏พ 1.771.
Since the observed value of the test statistic does not fall in the rejection
region ๏จ t ๏ฝ 0.906 ๏พ๏ฏ 1.771๏ฉ , H0 is not rejected. There is insufficient evidence to indicate that
๏ข 0 should be included in the model at ๏ก ๏ฝ 0.10.
3.73
a.
Some preliminary calculations are:
n = 10
2
รฅ x = 1,933,154
รฅ xy = 98,946,257
2
รฅ y =5,066,358,119
รฅ xy 98,946, 257
Then, ๏ขห1 =
=
= 51.18384619 ยป 51.184, and the least squares prediction
2
1,933,154
รฅx
equation is yห = 51.184x.
b.
To determine if population contributes to the prediction of electricity customers, we test:
H 0 : ๏ข1 ๏ฝ 0
H a : ๏ข1 ๏น 0
The test statistic is t =
๏ขห1
s
รฅx
2
(
)
2
รฅ y – ๏ขห1 รฅ xy
SSE
=
where s = s =
n -1
n -1
5,066,358,119 – 51.18385(98,946, 257)
=
= 460.4036
10 -1
2
Copyright ยฉ 2020 Pearson Education, Inc.
Chapter 3
Substituting, we have t =
3-43
51.18
= 154.56
460.4036 / 1,933,154
The rejection region requires ๏ก / 2 ๏ฝ 0.01 / 2 ๏ฝ 0.005 in each tail of the t distribution. From
Table 2, Appendix D, with df ๏ฝ n ๏ญ 1 ๏ฝ 10 ๏ญ 1 ๏ฝ 9, t0.005 ๏ฝ 3.250. The rejection region
is t ๏ผ ๏ญ3.250 or t ๏พ 3.250.
Since the observed value of the test statistic falls in the rejection region ๏จ t ๏ฝ 154.56 ๏พ 3.250 ๏ฉ ,
H0 is rejected. There is sufficient evidence to indicate that population contributes to the
prediction of electricity customers at ๏ก ๏ฝ 0.01.
c.
We need the following additional information:
รฅ x = 4286 รฅ y = 220, 297
๏ขห1 = 47.07
SS xx = 96,174.4 SS xy = 4,526,962.8 SS yy = 213,281,298
2
๏ขห0 = 1855.35 SSE = 195,568.4 s = 24,446.05
s = 156.3523
The least squares prediction equation is yห = 1855.35 + 47.07x.
To determine if population contributes to the prediction of electricity customers, we test:
H 0 : ๏ข1 ๏ฝ 0
H a : ๏ข1 ๏น 0
The test statistic is t =
๏ขห1
s / SS xx
=
47.07
156.3523 / 96,174.4
= 93.36
The rejection region requires ๏ก / 2 ๏ฝ 0.01 / 2 ๏ฝ 0.005 in each tail of the t distribution. From
Table 2, Appendix D, with df ๏ฝ n ๏ญ 2 ๏ฝ 10 ๏ญ 2 ๏ฝ 8, t0.005 ๏ฝ 3.355. The rejection region
is t ๏ผ ๏ญ3.355 or t ๏พ 3.355.
Since the observed value of the test statistic falls in the rejection region ๏จ t ๏ฝ 93.36 ๏พ 3.355 ๏ฉ ,
H0 is rejected. There is sufficient evidence to indicate that population contributes to the
prediction of electricity customers at ๏ก ๏ฝ 0.01.
d.
Without running a formal test, we can compare the two models. The value of s for the
model y = ๏ข1 x + ๏ฅ is 460.4036 while the value of s for the model y = ๏ข 0 + ๏ข1 x + ๏ฅ is
156.3523. Since the value of s is much smaller for the second model, it appears that the
second model should be used.
For a formal test, refer to part (d) of Exercise 3.66.
H0 : ๏ข0 ๏ฝ 0
H a : ๏ข0 ๏น 0
Copyright ยฉ 2020 Pearson Education, Inc.
3-44
Simple Linear Regression
The test statistic is t =
๏ขห0 – 0
x2
1
s
+
n SS xx
=
1855.35
1
428.62
156.3523
+
10 96,174.4
= 8.37
The rejection region requires ๏ก / 2 ๏ฝ 0.01 / 2 ๏ฝ 0.005 in each tail of the t distribution. From
Table 2, Appendix D, with df ๏ฝ n ๏ญ 1 ๏ฝ 10 ๏ญ 1 ๏ฝ 9, t0.005 ๏ฝ 3.250. The rejection region
is t ๏ผ ๏ญ3.250 or t ๏พ 3.250.
Since the observed value of the test statistic falls in the rejection region ๏จ t ๏ฝ 8.37 ๏พ 3.250 ๏ฉ ,
H0 is rejected. There is sufficient evidence to indicate that ๏ข 0 should be included in the
model at ๏ก ๏ฝ 0.01.
a.
Using MINITAB, the scatterplot is:
Fitted Line Plot
LOS = 3.306 + 0.01475 FACTORS
16
S
R-Sq
R-Sq(adj)
14
2.10077
37.4%
36.1%
12
10
LOS
3.74
8
6
4
2
0
100
200
300
400
500
FACTORS
b.
From the printout, the least squares line is yห ๏ฝ 3.306 ๏ซ 0.01475 x.
c.
For every one unit increase in the number of factors per patient, we estimate the patient’s
length of stay to increase 0.01475 days.
d.
To determine if the number of factors per patient contributes information for the prediction
of the patientโs length of stay, we test:
H 0 : ๏ข1 ๏ฝ 0
H a : ๏ข1 ๏น 0
The test statistic is t ๏ฝ 5.36 and the p-value is p ๏ผ 0.0001. Since the p-value is less
than ๏ก ๏จ p ๏ผ 0.0001 ๏ผ 0.05 ๏ฉ , H0 is rejected. There is sufficient evidence to indicate that the
number of factors per patient contributes information for the prediction of the patientโs
length of stay at ๏ก ๏ฝ 0.05.
Copyright ยฉ 2020 Pearson Education, Inc.
Chapter 3
3.75
3.76
3-45
e.
From the printout, the 95% confidence interval is (0.00922, 0.02029). We are 95% confident
that for each additional factor per patient, the patient’s length of stay will increase between
0.00917 and 0.02033 days.
f.
r ๏ฝ 0.3740 ๏ฝ 0.6116 There appears to be a moderate positive linear relationship between
the number of factors and the length of stay.
g.
r 2 ๏ฝ 0.3740 37.4% of the variability around the mean length of stay can be explained by
the linear relationship between the number of factors and the length of stay.
h.
From the printout, the 95% prediction interval is ๏จ 2.44798, 10.98081๏ฉ .
i.
There is a significant linear relationship between length of stay and the number of factors.
However, the value of r 2 is only r 2 ๏ฝ 0.3740. Thus, only a little over a third of the
variability in the lengths of stays is explained by the model. Many other variables could be
affecting the lengths of stay other than the number of factors.
a.
y = ๏ข 0 + ๏ข1 x + ๏ฅ
b.
A value of r ๏ฝ 0.68 indicates a moderate positive linear relationship between RMP and SET
ratings.
c.
The slope is positive since the correlation coefficient is positive.
d.
Since the p-value is so small ๏จ p ๏ฝ 0.001๏ฉ , H0 is rejected for any value of ๏ก ๏พ 0.001. This
indicates that there is a significant correlation between RMP and SET ratings.
e.
r 2 = (0.68) = 0.4624 46.24% of the variability of the sample SET ratings about their
mean can be explained by the linear relationship between the SET ratings and the RMP
ratings.
a.
Yes. For the men, as the year increases, the winning time tends to decrease. The
straight-line model is y ๏ฝ ๏ข 0 ๏ซ ๏ข1x ๏ซ ๏ฅ . We would expect the slope to be negative.
b.
Yes. For the women, as the year increases, the winning time tends to decrease. The
straight-line model is y ๏ฝ ๏ข 0 ๏ซ ๏ข1 x ๏ซ ๏ฅ . We would expect the slope to be negative.
c.
Since the slope of the womenโs line is steeper than that for the men, the slope of the
womenโs line will be greater in absolute value.
d.
No. The gathered data is from 1880 to 2000. Using this data to predict the time for the year
2020 would be very risky. We have no idea what the relationship between time and year
will be outside the observed range. Thus, we would not recommend using this model.
2
Copyright ยฉ 2020 Pearson Education, Inc.
3-46
Simple Linear Regression
3.77
Using MINITAB, the analyses are:
Analysis of Variance
Source
DF
Adj SS
Adj MS
F-Value
P-Value
Regression
1
72.04
72.04
7.11
0.056
DIAMETER
1
72.04
72.04
7.11
0.056
Error
4
40.55
10.14
Total
5
112.59
Model Summary
S
R-sq
R-sq(adj)
R-sq(pred)
3.18403
63.98%
54.98%
0.00%
Coefficients
Term
Coef
SE Coef
T-Value
P-Value
Constant
6.35
3.90
(-1.97, 14.68)
90% CI
1.63
0.179
DIAMETER
0.950
0.356
(0.190, 1.709)
2.67
0.056
VIF
1.00
Regression Equation
POROSITY
=
6.35 + 0.950 DIAMETER
Settings
Variable
Setting
DIAMETER
10
Prediction
3.78
Fit
SE Fit
90% CI
90% PI
15.8501
1.30529
(13.0674, 18.6327)
(8.51395, 23.1862)
a.
The least squares line is yห ๏ฝ 6.35 ๏ซ 0.950 x.
b.
๏ขห0 ๏ฝ 6.35 Since 0 is not in the range of observed values for diameter, ๏ขห0 has no meaning.
c.
From the printout the 90% confidence interval is ๏จ 0.190, 1.709 ๏ฉ . We are 90% confident that
for each unit increase in diameter, the mean porosity will increase from 0.190 and 1.709
units.
d.
From the printout, the 90% prediction interval is ๏จ 8.514, 23.186 ๏ฉ .
Using MINITAB, the analyses are:
Analysis of Variance
Source
DF
Seq SS
Contribution
Adj SS
Adj MS
F-Value
P-Value
Regression
1
0.2330
39.37%
0.2330
0.23300
9.09
0.009
EMPATHY
1
0.2330
39.37%
0.2330
0.23300
9.09
0.009
Error
14
0.3588
60.63%
0.3588
0.02563
Lack-of-Fit
10
0.2557
43.20%
0.2557
0.02557
0.99
0.552
Pure Error
4
0.1031
17.42%
0.1031
0.02578
Total
15
0.5918
100.00%
Copyright ยฉ 2020 Pearson Education, Inc.
Chapter 3
3-47
Model Summary
S
R-sq
R-sq(adj)
PRESS
R-sq(pred)
0.160084
39.37%
35.04%
0.484291
18.16%
Coefficients
Term
Coef
SE Coef
95% CI
T-Value
P-Value
Constant
-0.392
0.220
(-0.864, 0.079)
-1.79
0.096
EMPATHY
0.0362
0.0120
(0.0104, 0.0619)
3.02
0.009
VIF
1.00
Regression Equation
ACTIVITY
=
-0.392 + 0.0362 EMPATHY
To determine if people scoring higher in empathy show higher pain-related brain activity, we test:
H 0 : ๏ข1 ๏ฝ 0
H a : ๏ข1 ๏พ 0
The test statistic is t ๏ฝ 3.02 and the p-value is p ๏ฝ 0.009 / 2 ๏ฝ 0.0045. Since the p-value is very
small, H0 is rejected for any value of ๏ก ๏พ 0.0045. There is sufficient evidence to indicate that
people scoring higher in empathy show higher pain-related brain activity at ๏ก ๏พ 0.0045.
3.79
a.
Since the p-value for the SG score is p ๏ฝ 0.739 and is larger than the significance level of
0.05, then we cannot conclude that ESLR score is linearly related to the SG score.
b.
Since the p-value for the SR score is p ๏ฝ 0.012 and is smaller than the significance level of
0.05, then we can conclude that ESLR score is linearly related to the SR score.
c.
Since the p-value for the ER score is p ๏ฝ 0.022 and is smaller than the significance level of
0.05, then we can conclude that ESLR score is linearly related to ER score.
d.
100 r 2 % of the sample variation in ESLR score can be explained by the linear relationship
( )
between ESLR and x (SG, SR, or ER score)
a. 0.2% of the sample variation in ESLR scores around their means can be explained by the
linear relationship between ESLR and SG scores.
b. 9.9% of the sample variation in ESLR scores around their means can be explained by the
linear relationship between ESLR and SR scores.
c. 7.8% of the sample variation in ESLR scores around their means can be explained by the
linear relationship between ESLR and ER scores.
3.80
a.
Using MINITAB, the results of the analyses regressing the blood plasma level of
2,3,7,8-TCDD on the fat tissue level of 2,3,7,8-TCDD are:
Copyright ยฉ 2020 Pearson Education, Inc.
3-48
Simple Linear Regression
Analysis of Variance
Source
DF
Adj SS
Adj MS
F-Value
P-Value
Regression
1
1105.19
1105.19
132.05
0.000
FAT
1
1105.19
1105.19
132.05
0.000
Error
18
150.65
8.37
Lack-of-Fit
15
137.85
9.19
2.15
0.289
Pure Error
3
12.81
4.27
Total
19
1255.84
Model Summary
S
R-sq
R-sq(adj)
R-sq(pred)
2.89303
88.00%
87.34%
80.90%
Coefficients
Term
Coef
SE Coef
T-Value
P-Value
Constant
-0.150
0.841
-0.18
0.860
FAT
0.9009
0.0784
11.49
0.000
VIF
1.00
Regression Equation
PLASMA
=
-0.150 + 0.9009 FAT
The fitted prediction equation is yห ๏ฝ ๏ญ0.150 ๏ซ 0.9009 x.
Using MINITAB, the results of the analyses regressing the fat tissue level of
2,3,7,8-TCDD on the blood plasma level of 2,3,7,8-TCDD are:
Analysis of Variance
Source
DF
Adj SS
Adj MS
F-Value
P-Value
Regression
1
1198.32
1198.32
132.05
0.000
PLASMA
1
1198.32
1198.32
132.05
0.000
Error
18
163.35
9.07
Lack-of-Fit
15
154.56
10.30
3.52
0.164
Pure Error
3
8.79
2.93
Total
19
1361.67
Model Summary
S
R-sq
R-sq(adj)
R-sq(pred)
3.01245
88.00%
87.34%
80.90%
Coefficients
Term
Coef
SE Coef
T-Value
P-Value
Constant
0.970
0.846
1.15
0.267
PLASMA
0.9768
0.0850
11.49
0.000
VIF
1.00
Regression Equation
FAT
=
0.970 + 0.9768 PLASMA
The fitted prediction equation is yห ๏ฝ 0.970 ๏ซ 0.9768 x.
b.
To determine if fat tissue level is a useful predictor of blood plasma level, we test:
Copyright ยฉ 2020 Pearson Education, Inc.
Chapter 3
3-49
H 0 : ๏ข1 ๏ฝ 0
H a : ๏ข1 ๏น 0
The test statistic is t ๏ฝ 11.49 and the p-value is p ๏ฝ 0.000. Since the p-value is less
than ๏ก ๏จ p ๏ฝ 0.000 ๏ผ 0.05 ๏ฉ , H0 is rejected. There is sufficient evidence to indicate fat tissue
level is a useful predictor of blood plasma level at ๏ก ๏ฝ 0.05.
c.
To determine if blood plasma level is a useful predictor of fat tissue level, we test:
H 0 : ๏ข1 ๏ฝ 0
H a : ๏ข1 ๏น 0
The test statistic is t ๏ฝ 11.49 and the p-value is p ๏ฝ 0.000. Since the p-value is less
than ๏ก ๏จ p ๏ฝ 0.000 ๏ผ 0.05 ๏ฉ , H0 is rejected. There is sufficient evidence to indicate blood
plasma level is a useful predictor of fat tissue level at ๏ก ๏ฝ 0.05.
d.
Using MINITAB, the analyses of the data are:
Fitted Line Plot
STRIKES = 175.7 – 0.8195 AGE
90
S
R-Sq
R-Sq(adj)
80
15.4349
62.8%
57.4%
70
60
STRIKES
3.81
If we fit a least squares line through the data, the relationship will be the same regardless of
which variable is the dependent variable and which variable is the independent variable.
The correlation coefficient and the coefficient of determination will be the same regardless
of which variable is the dependent variable and which variable is the independent variable.
50
40
30
20
10
120
130
140
150
160
170
180
190
AGE
Analysis of Variance
Source
DF
Seq SS
Contribution
Adj SS
Adj MS
F-Value
P-Value
Regression
1
2810
62.76%
2810
2809.9
11.79
0.011
AGE
1
2810
62.76%
2810
2809.9
11.79
0.011
Error
7
1668
37.24%
1668
238.2
Total
8
4478
100.00%
Model Summary
S
R-sq
R-sq(adj)
PRESS
R-sq(pred)
15.4349
62.76%
57.43%
2582.04
42.33%
Coefficients
Term
Coef
SE Coef
T-Value
P-Value
Constant
175.7
38.6
(84.4, 267.0)
95% CI
4.55
0.003
AGE
-0.819
0.239
(-1.384, -0.255)
-3.43
0.011
VIF
1.00
Copyright ยฉ 2020 Pearson Education, Inc.
3-50
Simple Linear Regression
Regression Equation
STRIKES
=
175.7 – 0.819 AGE
a.
The fitted regression line is yห ๏ฝ 175.7 ๏ญ 0.819 x.
b.
We see from the plot that there appears to be a moderate negative linear relationship
between age and the mean number of strikes.
๏ขห0 ๏ฝ 175.7 Since 0 is not in the observed range of values of age, ๏ขห0 has no meaning.
๏ขห1 ๏ฝ ๏ญ0.819 For each additional day of age for the fish, we estimate that the mean number
of strikes will decrease by 0.819 strikes.
To determine if there is a linear relationship between age of fish and number of strikes, we
test:
H 0 : ๏ข1 ๏ฝ 0
H a : ๏ข1 ๏น 0
The test statistic is t ๏ฝ ๏ญ3.43 and the p-value is p ๏ฝ 0.011. Since the p-value is less
than ๏ก ๏จ p ๏ฝ 0.011 ๏ผ 0.05 ๏ฉ , H0 is rejected. There is sufficient evidence to indicate there is a
linear relationship between age of fish and number of strikes at ๏ก ๏ฝ 0.05.
r 2 ๏ฝ 0.6276 62.76% of the variability of the mean number of strikes about their mean is
explained by the linear relationship between age and number of strikes.
Using MINITAB, a scatterplot of the data is:
Fitted Line Plot
TIME = 4.790 + 0.01439 DEPTH
13
S
R-Sq
R-Sq(adj)
12
1.43219
63.0%
60.5%
11
10
TIME
3.82
9
8
7
6
5
4
0
100
200
300
400
DEPTH
There appears to be a linear relationship between the time to drill 5 feet and the depth at which
drilling begins.
Using MINITAB, the analyses of the data are:
Analysis of Variance
Source
DF
Adj SS
Adj MS
F-Value
P-Value
Regression
1
52.38
52.378
25.54
0.000
DEPTH
1
52.38
52.378
25.54
0.000
Error
15
30.77
2.051
Total
16
83.15
Copyright ยฉ 2020 Pearson Education, Inc.
Chapter 3
3-51
Model Summary
S
R-sq
R-sq(adj)
R-sq(pred)
1.43219
63.00%
60.53%
52.23%
Coefficients
Term
Coef
SE Coef
T-Value
P-Value
Constant
4.790
0.666
7.19
0.000
DEPTH
0.01439
0.00285
5.05
0.000
VIF
1.00
Regression Equation
TIME
=
4.790 + 0.01439 DEPTH
The fitted regression line is yห ๏ฝ 4.790 ๏ซ 0.01439 x.
๏ขห0 ๏ฝ 4.790 We estimate the mean time to drill 5 feet when starting at a depth of 0 feet is 4.79
minutes.
๏ขห1 ๏ฝ 0.01439 For each additional foot of depth, we estimate that the mean time to drill 5 feet
will increase by 0.0.01439 minutes.
To determine if there is a linear relationship between depth and time, we test:
H 0 : ๏ข1 ๏ฝ 0
H a : ๏ข1 ๏น 0
The test statistic is t ๏ฝ 5.05 and the p-value is p ๏ฝ 0.000. Since the p-value is less
than ๏ก ๏จ p ๏ฝ 0.000 ๏ผ 0.05 ๏ฉ , H0 is rejected. There is sufficient evidence to indicate there is a linear
relationship between depth and time at ๏ก ๏ฝ 0.05.
r 2 ๏ฝ 0.6300 63.00% of the variability of the mean time to drill 5 feet about their mean is
explained by the linear relationship between time to drill and depth that drilling starts.
3.83
a.
To determine if body plus head rotation and active head movement are positively linearly
related, we test:
H 0 : ๏ข1 = 0
H a : ๏ข1 > 0
The test statistic is t =
๏ขห1
s๏ขห
1
=
0.88 – 0
= 6.29.
0.14
The rejection region requires ๏ก = 0.05 in the upper tail of the t distribution with
df = n – 2 = 39 – 2 = 37. From Table 2, Appendix D, t0.05 ยป 1.687. The rejection region is
t > 1.687.
Copyright ยฉ 2020 Pearson Education, Inc.
3-52
Simple Linear Regression
Since the observed value of the test statistic falls in the rejection region (t = 6.29 > 1.687),
H0 is rejected. There is sufficient evidence to indicate that the two variables are positively
linearly related at ๏ก = 0.05.
For confidence level 0.90, ๏ก = 0.10 and ๏ก / 2 = 0.10 / 2 = 0.05. From Table 2, Appendix D,
with df = n – 2 = 39 – 2 = 37, t0.05 ยป 1.687. The confidence interval is:
๏ขห ๏ฑ t s ๏ 0.88 ๏ฑ 1.687 (0.14) ๏ 0.88 ๏ฑ 0.24 ๏ (0.64, 1.12)
b.
0.05 ๏ขห
1
1
We are 90% confident that the true value of ๏ข1 is between 0.64 and 1.12.
c.
3.84
Because the interval in part b contains the value 1, there is no evidence that the true slope of
the line differs from 1.
Using MINITAB, the analyses of the data are:
Analysis of Variance
Source
DF
Adj SS
Adj MS
F-Value
P-Value
Regression
1
6.096
6.0958
6.74
0.021
RECOVERY
1
6.096
6.0958
6.74
0.021
Error
14
12.654
0.9039
Lack-of-Fit
7
7.474
1.0677
1.44
0.320
Pure Error
7
5.180
0.7400
Total
15
18.750
Model Summary
S
R-sq
R-sq(adj)
R-sq(pred)
0.950722
32.51%
27.69%
19.69%
Coefficients
Term
Coef
SE Coef
T-Value
P-Value
Constant
2.970
0.790
3.76
0.002
RECOVERY
0.1267
0.0488
2.60
0.021
VIF
1.00
Regression Equation
LACTATE
=
2.970 + 0.1267 RECOVERY
To determine if blood lactate level is linearly related to perceived recovery, we test:
H 0 : ๏ข1 = 0
H a : ๏ข1 ยน 0
The test statistic is t ๏ฝ 2.60 and the p-value is p ๏ฝ 0.021. Since the p-value is less
than ๏ก ๏จ p ๏ฝ 0.021 ๏ผ 0.10 ๏ฉ , H0 is rejected. There is sufficient evidence to indicate blood lactate
level is linearly related to perceived recovery at ๏ก ๏ฝ 0.10.
3.85
a.
This relationship will have a negative correlation since the researchers claim an โinverse
relationshipโ.
Copyright ยฉ 2020 Pearson Education, Inc.
Chapter 3
b.
Solving t =
r n-2
1- r
2
3-53
for r using the smallest value of t that leads to a statistically significant
t2
result gives: r 2 = 2
. So if t = 1.645 leads to a rejection of H 0 : ๏ฒ = 0, then
t +n-2
2
(1.645)
r =
= .00801. Thus, r ๏ฝ ๏ญ 0.00801 ๏ฝ ๏ญ0.0895 since r is negative.
2
(1.645) + 337 – 2
2
3.86
a.
Using MINITAB, the results are:
Analysis of Variance
Source
DF
Seq SS
Contribution
Adj SS
Adj MS
F-Value
P-Value
Regression
1
0.8309
85.38%
0.8309
0.83089
46.73
0.000
TEMP
1
0.8309
85.38%
0.8309
0.83089
46.73
0.000
Error
8
0.1423
14.62%
0.1423
0.01778
Total
9
0.9731
100.00%
Model Summary
S
R-sq
R-sq(adj)
PRESS
R-sq(pred)
0.133347
85.38%
83.56%
0.340173
65.04%
Coefficients
Term
Constant
TEMP
Coef
SE Coef
-13.49
2.07
-0.05283
0.00773
95% CI
T-Value
P-Value
(-18.27, -8.71)
-6.51
0.000
(-0.07065, -0.03501)
-6.84
0.000
VIF
1.00
Regression Equation
PROPPASS
=
-13.49 – 0.05283 TEMP
The fitted regression line is yห ๏ฝ ๏ญ13.49 ๏ญ 0.0528 x.
๏ขห0 ๏ฝ ๏ญ13.49 Since 0 is not within the range of observed value of temperature, ๏ขห0 has no
meaning.
๏ขห1 ๏ฝ ๏ญ0.0528 For each degree increase in temperature, the mean proportion of impurity is
estimated to decrease by 0.0528.
b.
From the printout, the 95% confidence interval for ๏ข1 is ๏จ ๏ญ0.07065, ๏ญ 0.03501๏ฉ . We estimate
the mean proportion of impurity will decrease by anywhere from 0.07065 and 0.0351 for
each degree increase in temperature. Because 0 is not contained in this interval, there is
evidence to indicate that temperature contributes information about the proportions of
impurity passing through helium.
c.
From the printout, r 2 ๏ฝ 0.8538. 85.38% of the variability in the proportion of impurity
passing through helium around their means is explained by the linear relationship between
the temperature and the proportion of impurity.
Copyright ยฉ 2020 Pearson Education, Inc.
3-54
Simple Linear Regression
d.
Using MINITAB, the prediction interval is:
Settings
Variable
Setting
TEMP
-273
Prediction
Fit
SE Fit
0.931953
0.0557562
95% CI
95% PI
(0.803379, 1.06053)
(0.598655, 1.26525)
The 95% prediction interval is ๏จ 0.5987, 1.2653๏ฉ . We are 95% confident that the actual
proportion of impurities will be between 0.5987 and 1.2653 when the temperature is -273
degrees. Since the proportion cannot be greater than 1, the interval really is ๏จ 0.5987, 1.0 ๏ฉ .
3.87
e.
We have no idea what the relationship between temperature and proportion of impurity
looks like outside the observed range.
a.
Piano: r = 0.447
Because this value is near 0.5, there is a slight positive linear relationship between
recognition exposure time and goodness of view for piano.
Bench: r = -0.057
Because this value is extremely close to 0, there is an extremely weak negative linear
relationship between recognition exposure time and goodness of view for bench.
Motorbike: r = 0.619
Because this value is near 0.5, there is a moderate positive linear relationship between
recognition exposure time and goodness of view for motorbike.
Armchair: r = .294
Because this value is fairly close to 0, there is a weak positive linear relationship between
recognition exposure time and goodness of view for armchair.
Teapot: r = 0.949
Because this value is very close to 1, there is a strong positive linear relationship between
recognition exposure time and goodness of view for teapot.
b.
2
Piano: r 2 = (0.447) = 0.1998
19.98% of the total sample variability around the sample mean recognition exposure time is
explained by the linear relationship between the recognition exposure time and the goodness
of view for piano.
2
Bench: r 2 = (-0.057) = 0.0032
0.32% of the total sample variability around the sample mean recognition exposure time is
explained by the linear relationship between the recognition exposure time and the goodness
of view for bench.
2
Motorbike: r 2 = (0.619) = 0.3832
Copyright ยฉ 2020 Pearson Education, Inc.
Chapter 3
3-55
38.32% of the total sample variability around the sample mean recognition exposure time is
explained by the linear relationship between the recognition exposure time and the goodness
of view for motorbike.
2
Armchair: r 2 = (0.294) = 0.0864
8.64% of the total sample variability around the sample mean recognition exposure time is
explained by the linear relationship between the recognition exposure time and the goodness
of view for armchair.
2
Teapot: r 2 = (0.949) = 0.9006
90.06% of the total sample variability around the sample mean recognition exposure time is
explained by the linear relationship between the recognition exposure time and the goodness
of view for teapot.
c.
The test is:
H 0 : ๏ข1 = 0
H a : ๏ข1 ยน 0
Following are the values of ๏ก an t๏ก that correspond to df = n – 2 = 25 – 2 = 23.
2
๏ก
t๏ก
0.20
1.319
0.10
1.714
0.05
2.069
0.02
2.500
0.01
2.807
0.002
3.485
0.001
3.767
2
Piano: t = 2.40
2.069 < 2.40 0.025.
Bench: t = 0.27
0.27 0.2
H0 is not rejected. There is insufficient evidence to indicate that there is a linear relationship
between goodness of view and recognition exposure time for bench for ๏ก ยฃ 0.2.
Motorbike: t = 3.78
3.78 > 3.767 ๏ p < 0.001
H0 can be rejected for ๏ก ยณ 0.001. There is sufficient evidence to indicate that there is a
linear relationship between goodness of view and recognition exposure time for motorbike
for ๏ก ยณ 0.001.
Armchair: t = 1.47
1.319 < 1.47 < 1.717 ๏ p ยป 0.15
Copyright ยฉ 2020 Pearson Education, Inc.
3-56
Simple Linear Regression
H0 cannot be rejected for levels of significance ๏ก < 0.15. There is insufficient evidence to
indicate that there is a linear relationship between goodness of view and recognition
exposure time for armchair for ๏ก 3.767 ๏ p < 0.001
H0 can be rejected for ๏ก ยณ 0.001. There is sufficient evidence to indicate that there is a
linear relationship between goodness of view and recognition exposure time for teapot for
๏ก ยณ 0.001.
a.
Using MINITAB, the scatterplot of the data is:
Fitted Line Plot
100
80
60
PIPE
3.88
40
20
0
0
20
40
60
80
100
GUESS
There is a slight positive linear trend to the data.
b.
Using MINITAB, the results are:
Analysis of Variance
Source
DF
Adj SS
Adj MS
F-Value
P-Value
Regression
1
1779
1778.9
2.63
0.118
GUESS
1
1779
1778.9
2.63
0.118
Error
24
16261
677.6
Lack-of-Fit
20
14728
736.4
1.92
0.278
Pure Error
4
1534
383.4
Total
25
18040
VIF
Model Summary
S
R-sq
R-sq(adj)
R-sq(pred)
26.0298
9.86%
6.11%
0.00%
Coefficients
Term
Coef
SE Coef
T-Value
P-Value
Constant
30.1
11.4
2.63
0.015
GUESS
0.308
0.190
1.62
0.118
1.00
Regression Equation
PIPE
=
30.1 + 0.308 GUESS
Copyright ยฉ 2020 Pearson Education, Inc.
Chapter 3
3-57
The fitted regression line is yห ๏ฝ 30.1 ๏ซ 0.308 x.
๏ขห0 ๏ฝ 30.1 Because 0 is not within the observed values of the dowserโs guesses, ๏ขห0 has no
meaning.
c.
To determine if the model is statistically useful for predicting actual pipe location, we test:
H 0 : ๏ข1 = 0
H a : ๏ข1 ยน 0
The test statistic is t ๏ฝ 1.62 and the p-value is p ๏ฝ 0.118. Since the p-value is not small, H0 is
not rejected. There is insufficient evidence to indicate the model is statistically useful for
predicting actual pipe location at ๏ก ๏ผ 0.118.
Since there is no statistical evidence that there is a linear relationship between the dowsersโ
guesses and the pipe location, this refutes the conclusion made by the German physicists. In
addition, these were the โbestโ results of the โbestโ dowsers. If there was no relationship
between the dowsersโ guesses and the pipe location for the โbestโ of the โbestโ, there will not
be a relationship between dowsersโ guesses and the pipe locations for all of the dowsers.
a.
Using MINITAB, the scatterplot is:
Fitted Line Plot
HEIGHT = 9.147 + 0.4815 DIAMETER
25
20
HEIGHT
3.89
d.
15
10
5
10
15
20
25
30
DIAMETER
There appears to be a positive linear relationship between breast height diameter and height.
b.
Using MINITAB, the results are:
Analysis of Variance
Source
DF
Adj SS
Adj MS
F-Value
P-Value
Regression
1
183.245
183.245
65.10
0.000
DIAMETER
1
183.245
183.245
65.10
0.000
Error
34
95.703
2.815
Lack-of-Fit
27
87.893
3.255
2.92
0.073
Pure Error
7
7.810
1.116
Total
35
278.947
Model Summary
S
R-sq
R-sq(adj)
R-sq(pred)
1.67773
65.69%
64.68%
57.07%
Copyright ยฉ 2020 Pearson Education, Inc.
3-58
Simple Linear Regression
Coefficients
Term
Coef
SE Coef
T-Value
P-Value
Constant
9.15
1.12
8.16
0.000
DIAMETER
0.4815
0.0597
8.07
0.000
VIF
1.00
Regression Equation
HEIGHT
=
9.15 + 0.4815 DIAMETER
The least squares line is yห ๏ฝ 9.15 ๏ซ 0.4815 x.
๏ขห0 ๏ฝ 9.15
๏ขห1 ๏ฝ 0.4815
c.
The least squares line is printed on the scatterplot in part a.
d.
To determine if the breast height diameter contributes information for the prediction of tree
height, we test:
H 0 : ๏ข1 = 0
H a : ๏ข1 ยน 0
The test statistic is t ๏ฝ 8.07 and the p-value is p ๏ฝ 0.000. Since the p-value is less than
๏ก ๏จ p ๏ฝ 0.000 ๏ผ 0.05 ๏ฉ , H0 is rejected. There is sufficient evidence to indicate the breast
height diameter contributes information for the prediction of tree height at ๏ก ๏ฝ 0.05.
e.
Using MINITAB, the results are:
Settings
Variable
Setting
DIAMETER
20
Prediction
Fit
SE Fit
18.7763
0.299602
90% CI
90% PI
(18.2697, 19.2829)
(15.8945, 21.6581)
The 90% confidence interval is ๏จ18.2697, 19.2829 ๏ฉ . We are 90% confident that the mean
height of trees is between 18.2697m and 19.2829m when the breast height diameter is 20cm.
Copyright ยฉ 2020 Pearson Education, Inc.
Document Preview (58 of 1072 Pages)
User generated content is uploaded by users for the purposes of learning and should be used following SchloarOn's honor code & terms of service.
You are viewing preview pages of the document. Purchase to get full access instantly.
-37%
Solution Manual for A Second Course in Statistics: Regression Analysis, 8th Edition
$18.99 $29.99Save:$11.00(37%)
24/7 Live Chat
Instant Download
100% Confidential
Store
Michael Walker
0 (0 Reviews)
Best Selling
The World Of Customer Service, 3rd Edition Test Bank
$18.99 $29.99Save:$11.00(37%)
Chemistry: Principles And Reactions, 7th Edition Test Bank
$18.99 $29.99Save:$11.00(37%)
Solution Manual for Designing the User Interface: Strategies for Effective Human-Computer Interaction, 6th Edition
$18.99 $29.99Save:$11.00(37%)
Test Bank for Strategies For Reading Assessment And Instruction: Helping Every Child Succeed, 6th Edition
$18.99 $29.99Save:$11.00(37%)
Data Structures and Other Objects Using C++ 4th Edition Solution Manual
$18.99 $29.99Save:$11.00(37%)
2023-2024 ATI Pediatrics Proctored Exam with Answers (139 Solved Questions)
$18.99 $29.99Save:$11.00(37%)