Sampling: Design and Analysis, 2nd Edition Solution Manual

Preview Extract
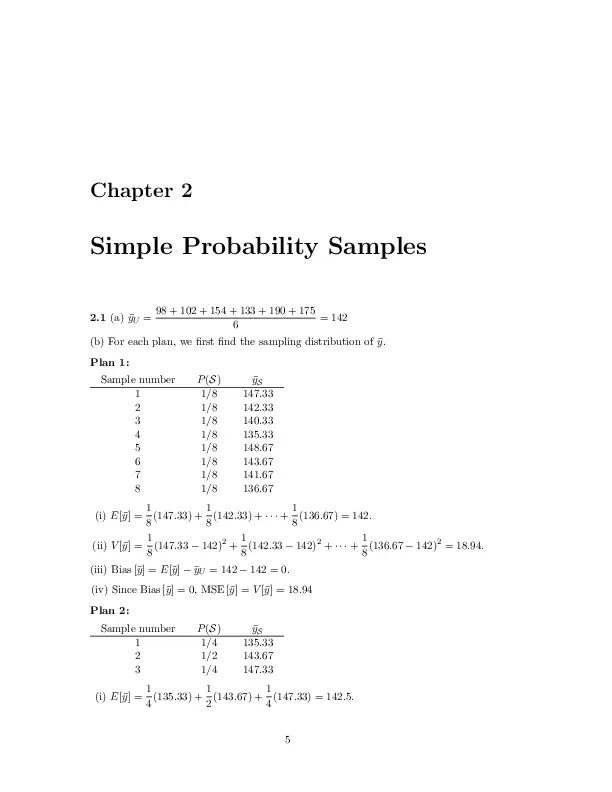
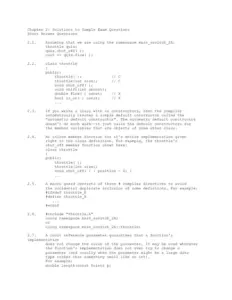
Chapter 2 Simple Probability Samples 2.1 (a) yฬ„U = 98 + 102 + 154 + 133 + 190 + 175 = 142 6 (b) For each plan, we first find the sampling distribution of yฬ„. Plan 1: Sample number 1 2 3 4 5 6 7 8 P (S) 1/8 1/8 1/8 1/8 1/8 1/8 1/8 1/8 yฬ„S 147.33 142.33 140.33 135.33 148.67 143.67 141.67 136.67 1 1 1 (i) E[yฬ„] = (147.33) + (142.33) + ยท ยท ยท + (136.67) = 142. 8 8 8 1 1 1 (ii) V [yฬ„] = (147.33 โˆ’ 142)2 + (142.33 โˆ’ 142)2 + ยท ยท ยท + (136.67 โˆ’ 142)2 = 18.94. 8 8 8 (iii) Bias [yฬ„] = E[yฬ„] โˆ’ yฬ„U = 142 โˆ’ 142 = 0. (iv) Since Bias [yฬ„] = 0, MSE [yฬ„] = V [yฬ„] = 18.94 Plan 2: Sample number 1 2 3 P (S) 1/4 1/2 1/4 yฬ„S 135.33 143.67 147.33 1 1 1 (i) E[yฬ„] = (135.33) + (143.67) + (147.33) = 142.5. 4 2 4 5 6 CHAPTER 2. SIMPLE PROBABILITY SAMPLES (ii) 1 1 1 (135.33 โˆ’ 142.5)2 + (143.67 โˆ’ 142.5)2 + (147.33 โˆ’ 142.5)2 4 2 4 = 12.84 + 0.68 + 5.84 V [yฬ„] = = 19.36. (iii) Bias [yฬ„] = E[yฬ„] โˆ’ yฬ„U = 142.5 โˆ’ 142 = 0.5. (iv) MSE [yฬ„] = V [yฬ„] + (Bias [yฬ„])2 = 19.61. (c) Clearly, Plan 1 is better. It has smaller variance and is unbiased as well. 2.2 (a) Unit 1 appears in samples 1 and 3, so ฯ€1 = P (S1 ) + P (S3 ) = Similarly, ฯ€2 = ฯ€3 = ฯ€4 = ฯ€5 = ฯ€6 = ฯ€7 = ฯ€8 = Note that 1 3 5 + = 4 8 8 1 1 3 + = 8 4 8 1 3 1 5 + + = 8 8 8 8 1 1 1 + = 8 8 4 1 1 3 5 + + = 8 8 8 8 1 1 3 + = 4 8 8 7 1 1 3 1 + + + = . 4 8 8 8 8 P8 i=1 ฯ€i = 4 = n. (b) Sample, S {1, 3, 5, 6} {2, 3, 7, 8} {1, 4, 6, 8} {2, 4, 6, 8} {4, 5, 7, 8} P (S) 1/8 1/4 1/8 3/8 1/8 tฬ‚ 38 42 40 42 52 Thus the sampling distribution of tฬ‚ is: k 38 40 42 52 P (tฬ‚ = k) 1/8 1/8 5/8 1/8 1 1 1 + = . 8 8 4 7 2.3 No, because thick books have a higher inclusion probability than thin books. 2.4 (a) A total of ( 83 ) = 56 samples are possible, each with probability of selection 1 56 . The R function samplist below will (inefficiently!) generate each of the 56 samples. To find the sampling distribution of yฬ„, I used the commands samplist <- function(popn,sampsize){ popvals <- 1:length(popn) temp <- comblist(popvals,sampsize) matrix(popn[t(temp)],nrow=nrow(temp),byrow=T) } comblist <- function(popvals, sampsize) { popsize popsize) stop(“sample size cannot exceed population size”) nvals <- popsize – sampsize + 1 nrows <- prod((popsize – sampsize + 1):popsize)/prod(1:sampsize) ncols <- sampsize yy <- matrix(nrow = nrows, ncol = ncols) if(sampsize == 1) {yy <- popvals} else { nvals <- popsize – sampsize + 1 nrows <- prod(nvals:popsize)/prod(1:sampsize) ncols <- sampsize yy <- matrix(nrow = nrows, ncol = ncols) rep1 1) { for(i in 2:nvals) rep1[i] <- (rep1[i – 1] * (sampsize + i – 2))/(i – 1) } rep1 <- rev(rep1) yy[, 1] <- rep(popvals[1:nvals], rep1) for(i in 1:nvals) { yy[yy[, 1] == popvals[i], 2:ncols] <- Recall( popvals[(i + 1):popsize], sampsize – 1) } } yy } temp1 <-samplist(c(1,2,4,4,7,7,7,8),3) temp2 Tkโˆ’1 : Ui โˆˆ [1, N ], Ui โˆˆ / {UT1 , . . . , UTkโˆ’1 }} for k = 2, . . . , n. Then for {x1 , . . . , xn } a set of n distinct elements in {1, . . . , N }, P (S = {x1 , . . . , xn }) = P ({UT1 , . . . , UTn } = {x1 , . . . , xn }) P {UT1 = x1 , . . . , UTn = xn } = E[P {UT1 = x1 , . . . , UTn = xn | T1 , T2 , . . . , Tn }] ยต ยถยต ยถยต ยถ ยต ยถ 1 1 1 1 = ยทยทยท N N โˆ’1 N โˆ’2 N โˆ’n+1 (N โˆ’ n)! = . N! Conditional on the stopping times T1 , . . . , Tn , UT1 is discrete uniform on {1, . . . , N }; (UT2 | T1 , . . . , TN , UT1 ) is discrete uniform on {1, . . . , N } โˆ’ {UT1 }, and so on. Since x1 , . . . , xn are arbitrary, P (S = {x1 , . . . , xn }) = 1 n!(N โˆ’ n)! = ยกN ยข , N! n so the procedure results in a simple random sample. (b) This procedure does not result in a simple random sample. Units starting with 5, 6, or 7 are more likely to be in the sample than units starting with 0 or 1. To see 17 this, letโ€™s look at a simpler case: selecting one number between 1 and 74 using this procedure. Let U1 , U2 , . . . be independent random variables, each with a discrete uniform distribution on {0, . . . , 9}. Then the first random number considered in the sequence is 10U1 + U2 ; if that number is not between 1 and 74, then 10U2 + U3 is considered, etc. Let T = min{i : 10Ui + Ui+1 โˆˆ [1, 74]}. Then for x = 10×1 + x2 , x โˆˆ [1, 74], P (S = {x}) = P (10UT + UT +1 = x) = P (UT = x1 , UT +1 = x2 ). For part (a), the stopping times were irrelevant for the distribution of UT1 , . . . , UTn ; here, though, the stopping time makes a difference. One way to have T = 2 is if 10U1 + U2 = 75. In that case, you have rejected the first number solely because the second digit is too large, but that second digit becomes the first digit of the random number selected. To see this formally, note that P (S = {x}) = P (10U1 + U2 = x or {10U1 + U2 โˆˆ / [1, 74] and 10U2 + U3 = x} or {10U1 + U2 โˆˆ / [1, 74] and 10U2 + U3 โˆˆ / [1, 74] and 10U3 + U4 = x} or . . .) = P (U1 = x1 , U2 = x2 ) ยต tโˆ’1 โˆž X + P {Ui > 7 or t=2 [Ui = 7 and Ui+1 > 4]} i=1 ยถ and Ut = x1 and Ut+1 = x2 . Every term in the series is larger if x1 > 4 than if x1 โ‰ค 4. (c) This method almost works, but not quite. For the first draw, the probability that 131 (or any number in {1, . . . , 149, 170} is selected is 6/1000; the probability that 154 (or any number in {150, . . . , 169}) is selected is 5/1000. (d) This clearly does not produce an SRS, because no odd numbers can be included. (e) If class sizes are unequal, this procedure does not result in an SRS: students in smaller classes are more likely to be selected for the sample than are students in larger classes. Consider the probability that student j in class i is chosen on the first draw. P {select student j in class i} = P {select class i}P {select student j | class i} 1 1 . = 20 number of students in class i (f) Letโ€™s look at the probability student j in class i is chosen for first unit in the sample. Let U1 , U2 , . . . be independent discrete uniform {1, . . . , 20} and let V1 , V2 , . . . 18 CHAPTER 2. SIMPLE PROBABILITY SAMPLES be independent discrete P20uniform {1, . . . , 40}. Let Mi denote the number of students in class i, with K = i=1 Mi . Then, because all random variables are independent, P (student j in class i selected) = P (U1 = i, V2 = j) + P (U2 = i, V2 = j)P ยต[ 20 ยถ {U1 = k, V1 > Mk } k=1 ยฝ ยพY ยต[ ยถ l 20 + ยท ยท ยท + P Ul+1 = i, Vl+1 = j P {Uq = k, Vq > Mk } q=1 = l=0 = = k=1 +ยทยทยท ยต[ ยถยธ โˆž ยท l 20 1 1 X Y P {Uq = k, Vq > Mk } 20 40 q=1 k=1 โˆž ยทX 20 X 1 40 โˆ’ Mk 20 40 l=0 k=1 ยธ โˆž ยท K l 1 X 1โˆ’ 800 800 1 800 ยธl l=0 = 1 1 1 = . 800 1 โˆ’ (1 โˆ’ K/800) K Thus, before duplicates are eliminated, a student has probability 1/K of being selected on any given draw. The argument in part (a) may then be used to show that when duplicates are discarded, the resulting sample is an SRS. 2.22 (a) From (2.13), p V (yฬ„) CV(yฬ„) = = E(yฬ„) r n S . 1โˆ’ โˆš N nyฬ„U Substituting pฬ‚ for yฬ„, and NNโˆ’1 p(1 โˆ’ p) for S 2 , we have s CV(pฬ‚) == ยณ n ยด N p(1 โˆ’ p) 1โˆ’ = N (N โˆ’ 1)np2 The CV for a sample of size 1 is 2 CV2 /r 2 . zฮฑ/2 s N โˆ’n1โˆ’p . N โˆ’ 1 np p (1 โˆ’ p)/p. The sample size in (2.26) will be (b) I used Excel to calculate these values. p 0.001 Fixed 4.3 Relative 4264176 0.005 21.2 849420 0.01 42.3 422576 0.05 202.8 81100 0.1 384.2 38416 0.3 896.4 9959.7 p Fixed Relative 0.9 384.2 474.3 0.95 202.8 224.7 0.99 42.3 43.1 0.995 21.2 21.4 0.999 4.3 4.3 0.7 896.4 1829.3 0.5 1067.1 4268.4 19 2.23 ยต ยถยต ยถ 3059 19 300 0 ยต ยถ P (no missing data) = 3078 300 (2778)(2777) . . . (2760) = (3078)(3077) . . . (3060) = 0.1416421. 2.24 ยณ n ยด S2 g(n) = L(n) + C(n) = k 1 โˆ’ + c0 + c1 n. N n dg kS 2 = โˆ’ 2 + c1 dn n Setting the derivative equal to 0 and solving for n gives s kS 2 . n= c1 The sample size, in the decision theoretic approach, should be larger if the cost of a bad estimate, k, or the variance, S 2 , is larger; the sample size is smaller if the cost of sampling is larger. 2.25 (a) Skewed, with tail on right. (b) yฬ„ = 20.15, s2 = 321.357, SE [yฬ„] = 1.63 2.26 In a systematic sample, the population is partitioned into k clusters, each of size n. One of these clusters is selected with probability 1/k, so ฯ€i = 1/k for each i. But many of the samples that could be selected in an SRS cannot be selected in a systematic sample. For example, P (Z1 = 1, . . . , Zn = 1) = 0 : since every kth unit is selected, the sample cannot consist of the first n units in the population. 2.27 (a) ยต P (you are in sample) = = = ยถยต ยถ 99,999,999 1 999 1 ยต ยถ 100,000,000 1000 99,999,999! 1000! 99,999,000! 999! 99,999,000! 100,000,000! 1000 1 = . 100,000,000 100,000 20 (b) CHAPTER 2. SIMPLE PROBABILITY SAMPLES ยต P (you are not in any of the 2000 samples) = 1 โˆ’ 1 100,000 ยถ2000 = 0.9802 (c) P (you are not in any of x samples) = (1 โˆ’ 1/100,000)x . Solving for x in (1 โˆ’ 1/100,000)x = 0.5 gives x log(.99999) = log(0.5), or x = 69314.4. Almost 70,000 samples need to be taken! This problem provides an answer to the common question, โ€œWhy havenโ€™t I been sampled in a poll?โ€ 2.28 (a) We can think of drawing a simple random sample with replacement as performing an experiment n independent times; on each trial, outcome i (for i โˆˆ {1, . . . , N }) occurs with probability pi = 1/N . This describes a multinomial experiment. We may then use properties of the multinomial distribution to answer parts (b) and (c): n E[Qi ] = npi = , N ยต ยถ n 1 V [Qi ] = npi (1 โˆ’ pi ) = 1โˆ’ , N N and n 1 for i 6= j. Cov [Qi , Qj ] = โˆ’npi pj = โˆ’ NN (b) ยทX ยธ N N N NX n E[tฬ‚] = E Qi yi = yi = t. n n N i=1 (c) ยต V [tฬ‚] = ยต = ยต = ยต = = N n N n N n N n N n V # Qi yi i=1 ยถ2 X N N X yi yj Cov [Qij Qj ] i=1 j=1 ยถ2 ยฝ X N yi2 npi (1 โˆ’ pi ) + i=1 ยถ2 ยฝ N X X ยพ yi yj (โˆ’npi pj ) i=1 j6=i ยต ยถ N ยพ N N n 1 X 2 n 1 XX 1โˆ’ yi โˆ’ yi yj N N NN i=1 ยฝX N ยพ yi2 โˆ’ N yฬ„U2 i=1 N P = “N X ยถ2 i=1 (yi โˆ’ yฬ„U )2 N 2 i=1 . n N i=1 j6=i 21 2.29 We use induction. Clearly, S0 is an SRS of size n from a population of size n. Now suppose Skโˆ’1 is an SRS of size n from Ukโˆ’1 = {1, 2, . . . , n + k โˆ’ 1}, where k โ‰ฅ 1. We wish to show that Sk is an SRS of size n from Uk = {1, 2, . . . , n + k}. Since Skโˆ’1 is an SRS, we know that P (Skโˆ’1 ) = ยต 1 n!(k โˆ’ 1)! ยถ= . (n + k โˆ’ 1)! n+kโˆ’1 n Now let Uk โˆผ Uniform(0, 1), let Vk be discrete uniform (1, . . . , n), and suppose Uk and Vk are independent. Let A be a subset of size n from Uk . If A does not contain unit n + k, then A can be achieved as a sample at step k โˆ’ 1 and ยถ ยต n P (Sk = A) = P Skโˆ’1 and Uk > n+k k = P (Skโˆ’1 ) n+k n!k! = . (n + k)! If A does contain unit n + k, then the sample at step k โˆ’ 1 must contain Akโˆ’1 = A โˆ’ {n + k} plus one other unit among the k units not in Akโˆ’1 . ยต ยถ X n P Skโˆ’1 = Akโˆ’1 โˆช {j} and Uk โ‰ค and Vk = j P (Sk = A) = n+k C jโˆˆUkโˆ’1 โˆฉAkโˆ’1 n!(k โˆ’ 1)! n 1 (n + k โˆ’ 1)! n + k n n!k! . (n + k)! = k = 2.30 I always use this activity in my classes. Students generally get estimates of the total area that are biased upwards for the purposive sample. They think, when looking at the picture, that they donโ€™t have enough of the big rectangles and so tend to oversample them. This is also a good activity for reviewing confidence intervals and other concepts from an introductory statistics class. 22 CHAPTER 2. SIMPLE PROBABILITY SAMPLES

Document Preview (18 of 258 Pages)

User generated content is uploaded by users for the purposes of learning and should be used following SchloarOn's honor code & terms of service.
You are viewing preview pages of the document. Purchase to get full access instantly.

Shop by Category See All


Shopping Cart (0)

Your bag is empty

Don't miss out on great deals! Start shopping or Sign in to view products added.

Shop What's New Sign in