Preview Extract
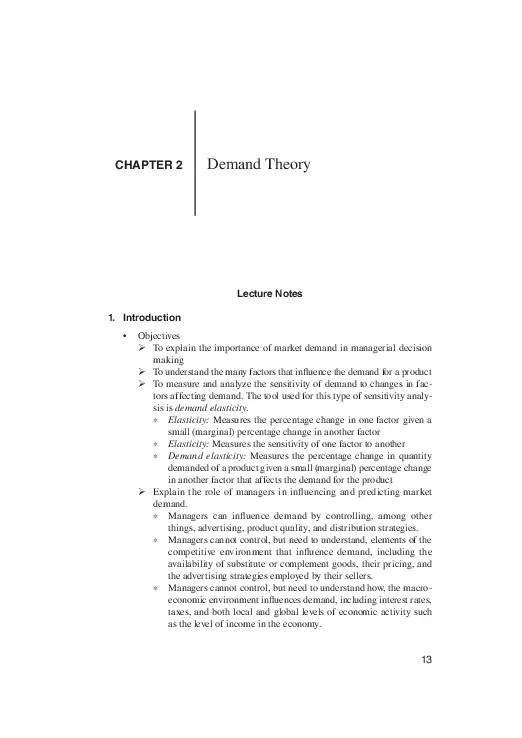
CHAPTER 2
Demand Theory
Lecture Notes
1. Introduction
โข
Objectives
รฟ To explain the importance of market demand in managerial decision
making
รฟ To understand the many factors that influence the demand for a product
รฟ To measure and analyze the sensitivity of demand to changes in factors affecting demand. The tool used for this type of sensitivity analysis is demand elasticity.
* Elasticity: Measures the percentage change in one factor given a
small (marginal) percentage change in another factor
* Elasticity: Measures the sensitivity of one factor to another
* Demand elasticity: Measures the percentage change in quantity
demanded of a product given a small (marginal) percentage change
in another factor that affects the demand for the product
รฟ Explain the role of managers in influencing and predicting market
demand.
* Managers can influence demand by controlling, among other
things, advertising, product quality, and distribution strategies.
* Managers cannot control, but need to understand, elements of the
competitive environment that influence demand, including the
availability of substitute or complement goods, their pricing, and
the advertising strategies employed by their sellers.
* Managers cannot control, but need to understand how, the macroeconomic environment influences demand, including interest rates,
taxes, and both local and global levels of economic activity such
as the level of income in the economy.
13
14 | Chapter 2
2. The Market Demand Curve
โข
โข
โข
โข
โข
โข
Market Demand Schedule: A table showing the total quantity of the good
purchased at each price during a given time period
Market Demand Curve: A plot of the market demand schedule on a graph
Example (Table 2.1): Demand schedule for tablets
It shows the total quantity of tablets demanded at each price, not the quantity demanded from a par ticular firm.
รฟ Convention: Price is on the vertical axis and quantity is on the horizontal axis.
รฟ Example (Figure 2.1): Demand curve for tablets
Characteristics of the Market Demand Curve
รฟ Quantity demanded is for output of the entire market or the industry,
not of a single firm.
รฟ For most products and services, the market demand curve slopes
downward and to the right.
รฟ Example: The quantity of tablets demanded increases as the price of
tablets falls.
รฟ Quantity demanded is defined with regard to a par ticular time
period.
Determinants of the position and shape of the market demand curveโ
Some of the important factors include
รฟ Consumer tastes or preferences
* An increase in consumer tastes shifts the demand curve to the right.
* A decrease in consumer tastes shifts the demand curve to the left.
รฟ Consumer income (or more specifically per capita disposable income)
* Normal and inferior goods
* Example (Figure 2.3): Increase in income causes an increase in
demand for tablets; that is, tablets are a normal good.
รฟ Population size in the market
STRATEGY SESSION:
The Customer Is Always RightโWrong!
Discussion Questions
1. Like retail technology stores, clothing stores have their angels and devils.
How do you think the devils prey on clothing stores, and how could their
behavior be discouraged? How do you think angels could be encouraged
to shop at a par ticular clothing store?
Answer: Devils buy clothes, wear them, and then return them for a refund.
Stores can refuse to provide refunds on returns and, instead, provide a
credit for future purchases or only allow exchanges. Angels buy lots of
clothes on impulse. Stores could offer quantity discounts or a โshoppers
clubโ with special notification of sales.
Demand Theory | 15
2. Some electronics stores refuse to allow customers to return or exchange
products, instead requiring them to deal directly with the manufacturer.
What are the pros and cons of this approach with regard to the storesโ
objective of encouraging angels and discouraging devils?
3. Industry and Firm Demand Functions
โข
Market Demand Function: The relationship between the quantity
demanded of a product and the various factors that influence this quantity
รฟ Quantity demanded of good X: Q f(factors) f(P, P_r, I, T, N, A, โฆ)
รฟ Factors include
* price of X: P
* incomes of consumers: I
* tastes of consumers: T
* prices of related goods in consumption: P_r
* population size: N
* advertising expenditures: A
* general demand function:
Q f(factors) f(P, P_r,I,T,N,A, other factors)
รฟ Example (equation 2.1): A linear demand function:
Q b1P b2 I b3S b4 A
Assumes that population is constant
P price of tablets
I per capita disposable income
S average price of software
A amount spent on advertising
b1, b2, b3, and b4 are parameters that are estimated using statistical
methods, namely, regression analysis.
Parameters: Constant or variable terms used in the function that helps
managers determine the specific form of the function but not its general nature
* Example: Q 2,000P 70I 375S 0.0001A
Relationship between the market demand function and the market
demand curve
* The market demand curve shows the relationship between Q and
P when all other variables are held constant at specific values.
* The market demand function does not explicitly hold any values
constant.
Example (equation 2.3): Suppose I 13,000, S 400, and A 50 million. Then
Q 700P 200(13,000) 500(400) 0.01(50,000,000)
That is
*
*
*
*
*
*
รฟ
รฟ
รฟ
รฟ
16 | Chapter 2
*
Q 2,900,000 700P (direct demand function)
Solving for P in terms of Q gives the inverse demand function:
P 4,143 0.001429Q (graphed in Figure 2.4)
รฟ Example: Shifting the demand curve
Suppose the price of software falls from $400 to $200. Then
Q 700P 200(13,000) 500(200) 0.01(50,000,000)
Q 3,000,000 700P
*
Solving for P gives
P 4,286 0.001429Q (graphed in Figure 2.4)
โข
Note: Same slope; only the vertical intercept changes.
The Firmโs Demand Curve
รฟ Negative slope with regard to own price
* Slope may not be the same as that of the market demand curve
รฟ Represents a portion of market demand
* Market share
* Responds to same market and macroeconomic factors as the market demand curve
4. The Own-Price Elasticity of Demand
โข
Own-Price Elasticity of Demand: More simply referred to as the price elasticity of demand, it is the concept that managers use to measure the percentage change in quantity demanded of their firmโs products resulting
from a 1% change in the productsโ own prices.
รฟ The elasticity of a function is the percentage change in the dependent
(Y) variable in response to a 1% change in the independent (X) variable.
รฟ The price elasticity of a demand function is the percentage change in
quantity demanded in response to a 1% change in price.
รฟ Formula:
โ P โ Q
=โ โ
โ Q โ P
รฟ Along a demand function, it is given by
โ P โ โQ
=โ โ
โ Q โ โP
รฟ Price elasticity of demand generally is different at different prices and
on different markets.
Demand Theory | 17
โข
Terminology
รฟ Price elasticity of demand is symbolized by the Greek letter eta (h) (not
a general convention).
รฟ Fact: 0 โฅ h โฅ โ. That is, price elasticity of demand is always nonpositive.
รฟ When |h| 1, demand is elastic.
รฟ When |h| 1, demand is inelastic.
รฟ When |h| 1 or h 1, demand is unitary.
Limiting cases:
รฟ When h 0, demand is perfectly inelastic and the demand curve is
vertical.
* Quantity demanded is the same at all prices.
รฟ When h โ, demand is perfectly elastic and the demand curve is
horizontal.
* Price is the same for all quantities demanded.
* If price rises, quantity demanded falls to zero.
* If price falls, quantity demanded increases without limit.
โข Linear Demand Curves
รฟ The slope of a linear demand curve is constant.
รฟ If the demand curve is neither vertical nor horizontal, the price elasticity will vary depending on price level.
* At the midpoint of a linear demand curve, h 1, with h approaching zero as price approaches the vertical intercept.
* At prices above the midpoint, demand is elastic, with h approaching
negative infinity as quantity approaches zero or as price approaches
the vertical intercept.
* At prices below the midpoint, demand is inelastic, with h approaching 0 as price approaching 0.
รฟ Given a demand curve defined as P abQ, the price elasticity of
โ1 a โ bQ
= โ P / (a โ P )
demand is: = โโ โโ
โ bโ Q
5. Point and Arc Elasticities
โข
The point price elasticity formula should be used when working with an
estimated demand curve or when the change in price is very small. It is
written as
โ P โ โQ
=โ โ
โ Q โ โP
รฟ Calculated value of price elasticity for small changes in prices will
differ depending on whether P and Q are the starting values or the
ending values after the price change. The change will be small if the
change is small.
18 | Chapter 2
โข
* Example: P1 99.95, P2 100.00, Q1 20,002, and Q2 20,000
* h [(20,002 20,000)/(99.95 100)][99.95/20,002] 0.1999
* h [(20,000 20,002)/(100 99.95][100/200,000] 0.22
รฟ If the price change is large, then the direction of change will influence
the calculated elasticity.
* Example: P1 5, P2 4, Q1 3, and Q2 40
* h [(40 3)/(4 5)][5/3] 61.67
* h [(3 40)/(5 4)][4/40] 3.70
รฟ This problem is corrected by using the arc or midpoint formula.
Recommendation: The midpoint or arc elasticity formula should be used
to estimate the price elasticity of demand from a demand schedule where
price differences are not very small. It is given by
โ Q โ โ P1 + P2 โ
=โ
โ P โโ โโ Q1 + Q2 โโ
รฟ Example: P1 5, P2 4, Q1 3, and Q2 40
รฟ h [(40 3)/(4 5)][(5 4)/(3 40)] 7.74
6. Using the Demand Function to Calculate the Price Elasticity
of Demand
Whenever the demand function is specified, one usually uses the point price
elasticity of demand.
โข Example: Given
รฟ Q 700P 200I 500S 0.01A
รฟ Q Quantity demanded of tablet computers
รฟ Price P 3,000
รฟ Income I 13,000
รฟ Software S 400
รฟ Advertising A 50,000,000
โข Derive the demand curve
รฟ Q 700P (200)(13,000) (500)(400) (0.01)(50,000,000)
รฟ Q 2,900,000 700P
โข Determine Q
รฟ Q 2,900,000 (700)(3,000) 800,000.
โQ
We have
= โ700. Thus
โP
โข h (700)(3,000/800,000) 2.62
โข For P 2,000, Q 2,900,000 (700)(2,000) 1,500,000,
so h (700)(2,000/1,500,000) 0.93
Demand Theory | 19
7. The Effect of Price Elasticity on the Firmโs Revenue
โข
Derivation of relationship between marginal revenue (TR/Q or dTR/
dQ) and the price elasticity of demand
รฟ Total revenue: TR PQ
รฟ Consider quantity as a function of price: Q f(P). Then, differentiating TR with respect to P, using the product rule for derivative, gives
dTR/dP Q(dP/dP) P(dQ/dP)
Dividing by Q gives
(1/Q)(dTR/dP) (dP/dP) (P/Q)(dQ/dP) 1 h
โข
โข
โข
โข
โข
1/Q is positive.
Implications:
รฟ Case 1: If h 1, that is, unitary elastic demand, then 1 h 0, and
dTR/dP 0, so total revenue is at a maximum and a change in P will
have no effect on total revenue.
รฟ Case 2: If h 1 (inelastic demand ), then 1 h 0 and dTR/dP 0,
so an increase in P (and consequent decrease in Q) will increase total
revenue.
รฟ Case 3: If h 1 (elastic demand ), then 1 h 0, and dTR/dP 0,
so an increase in P (and consequent decrease in Q) will reduce total
revenue.
รฟ To summarize:
If the price elasticity is unitary, any price change will cause an equal and
opposite percentage change in quantity demanded. Total revenue will
remain constant.
If the price elasticity is in the inelastic range, then a 1% change in P will
cause less than a 1% change in quantity in the opposite direction. Therefore, total revenue will change in the same direction as price.
If the price elasticity is in the inelastic range, then a 1% change in P will
cause more than a 1% change in quantity in the opposite direction. Therefore, total revenue will change in the opposite direction from price.
PROBLEM SOLVED:
Price Elasticity of Demand: Philip Morris
Discussion Questions
1. The decline in total revenue from cigarette sales in 1993 is attributed to
Philip Morrisโs cut in the price of cigarettes. Are there other factors that
might have contributed to this decline in revenue?
Answer: The price elasticity of demand assumes that โall other thingsโ
are held constant. Changes in taxes, consumer income, or attitudes toward
20 | Chapter 2
tobacco during this period might have reduced demand, while the price
cut increased quantity demanded. If this was the case, then the true price
elasticity would likely be closer to 1.
8. Funding Public Transit
โข
โข
Given
รฟ Price (fare) elasticity of demand for public transit in the United States
is estimated to be about 0.3.
Facts:
รฟ All public transit systems in the United States lose money.
รฟ Public transit systems are funded by federal, state, and local governments, all of which have budget issues.
Which transit systems have the most difficult time getting public funding?
รฟ Revenue from sales will increase if fares are increased because demand
is inelastic.
รฟ Costs will likely decrease if fares are increased because quantity
demanded (ridership) will fall.
รฟ Implication: Managers of public transit will therefore increase fares if
they do not receive enough public funds to balance their budgets.
9. Determinants of the Own-Price Elasticity of Demand
โข
โข
โข
Number and Similarity of Available Substitutes
Fact: A product with many close substitutes generally has elastic demand.
Productโs Price Relative to a Consumerโs Total Budget
รฟ Facts:
* Products for which the typical consumer spends only a very small
fraction of her income are quite elastic.
ยฐ Examples: Thimbles, rubber bands, salt
* Products that command a larger percentage of the consumerโs
total budget tend to be more price elastic.
ยฐ Examples: Kitchen appliances, automobiles
Time Period Available for Adjustment to a Price Change
รฟ Fact: For nondurable goods, demand is likely to be more elastic over
a long period relative to a short period.
รฟ Rationale: The longer the time period, the easier it is for consumers to
substitute one good for another.
10. The Strategic Use of the Price Elasticity of Demand
โข
โข
Managers can change the price elasticity of demand for their products.
A Useful Tool: Product differentiation
Demand Theory | 21
โข
โข
โข
Differentiation strategies convince consumers the product is unique;
hence it has fewer substitutes.
Caution: Differentiation is not effective if consumers do not perceive it.
Example: Strategic pricing of first-class (h 0.45), regular economy
(h 1.30), and excursion (h 1.83) airline tickets between the United
States and Europe
รฟ First-class prices should be relatively high because demand is inelastic.
รฟ Regular economy and excursion prices should be relatively low because
demand is elastic.
รฟ If consumers perceive that a product has fewer substitutes, then their
price elasticity of demand for the product will decrease (become less
elastic) in absolute value.
รฟ Differentiation strategies do not require actual differences in products, only a perceived difference.
STRATEGY SESSION:
Elasticity in Use
Discussion Questions
1. Suppose that a manufacturer sells a product through an upscale boutique
and, with a different brand name, through a discount retailer. The elasticity
of demand at the boutique is 1.2, and at the discount retailer it is 2.6. If
the optimal price at the boutique is $85, what price (PD) should be charged
at the discount retailer?
Answer: 85(1 1/1.2) PD (1 1/2.6) so PD $23.02
2. A consulting firm charges $250 per hour to Fortune 500 companies. The
estimated elasticity of demand for consulting services is 3.1. The firm is
planning to spin off a subsidiary firm that will work with smaller businesses.
The estimated elasticity of demand for these firms is 7.3. What price per
hour (PS), to the nearest dollar, should be charged by the subsidiary?
Answer: 250(1 1/3.1) PS (1 1/7.3) so PS $200
11. Total Revenue, Marginal Revenue, and Price Elasticity
โข
โข
A firmโs total revenue (TR) is equal to the total amount of money consumers
spend on the product in a given time period.
รฟ Linear demand curve: P aโ bQ
รฟ Corresponding total revenue curve: TR PQ aQโ bQ2
Marginal Revenue: The incremental revenue earned from selling an additional unit of output
รฟ MR dTR/dQ d( aQโ bQ2)/dQ a 2bQ
* h (1/b)[(aโbQ)/Q] a/(bQ) 1
22 | Chapter 2
* Case 1: If Q a/2b, then h 1, unitary elastic demand.
* Case 2: If Q a/2b, then h 1, and demand is inelastic.
* Case 3: If Q a/2b, then h 1, and demand is elastic.
รฟ MR dTR/dQ d(PQ)/dQ P(dQ/dQ) Q(dP/dQ) P[1 (Q/P)
(dP/dQ). Thus MR P(1 1/h)
* Case 1: |h| 1 (elastic) implies MR 0.
* Case 2: |h| 1 (inelastic) implies MR 0.
* Case 3: |h| 1 (unitary elastic) implies MR 0.
12. The Income Elasticity of Demand
โข
Income Elasticity of Demand (hI): Measures the percentage change in quantity demanded (Q) resulting from a 1% change in consumer income (I)
รฟ Income can be defined as aggregate consumer income or as per capita
disposable income, depending on circumstances.
โ Q โ โ I โ
รฟ I = โ
โ I โโ โโ Q โโ
รฟ For a demand function, it is given by
โ I โ โQ
=โ โ
โ Q โ โI
โQ
> 0 for normal goods.
โI
* For most products, hI 0; that is, most goods are normal, since
increases in aggregate income are associated with increases in
aggregate consumer spending.
โQ
รฟ hI 0 for inferior goods because
< 0 for inferior goods.
โI
* Examples: Hamburgers and public transportation
* Fact: When the economy is expanding, products with high-income
elasticities will enjoy a significant increase in sales and managers
must prepare for probable significant increase in sales.
Strategic Management and the Income Elasticity of Demand
รฟ The demand for a product that has an income elasticity of demand that
is large in absolute value will vary widely with changes in income
caused by economic growth and recessions.
รฟ Managers can lessen the impact of economic changes on such products by limiting fixed costs so that changes in production capacity can
be made quickly.
รฟ Managers can forecast demand for products using the income elasticity of demand combined with forecasts of aggregate income.
รฟ hI
โข
0 for normal goods because
Demand Theory | 23
PROBLEM SOLVED:
Income Elasticity of Demand
Discussion Questions
1. Suppose that a market demand function is defined as Q 20,000 8P 0.1I
and suppose that P 2,000 and I 20,000. What is the income elasticity
of demand at this point?
Answer:
Here, we have
โQ
0.1 (a normal good). Then we have
โI
Q 6,000, so that hI 0.1(20,000/6,000) 1/3
2. If the income elasticity of demand for a product is unitary, then a 1%
change in income will change demand in the same direction by 1%. If
price remains constant, then spending on the product will change by 1%
and, consequently, spending on the product will be the same percentage
of income after the income change as it was before. If the income elasticity of demand is greater than one, then spending will increase as a percentage of income as income increases. If it is less than one, spending will
decrease as a percentage of income as income increases. How do you think
the percentage of income spent on jewelry, food, clothing, housing, and
automobiles responds to a 1% increase in income?
13. Cross-Price Elasticities of Demand
โข
Cross-Price Elasticity of Demand (hXY): The percentage change in quantity demanded of one good (QX) resulting from a 1% change in the price of
a related good (PY)
รฟ Income can be defined as aggregate consumer income or as per capita
disposable income, depending on circumstances.
โ QX โ โ PY โ
รฟ
XY = โ
โ
โโ
โ PY โ โ QX โ
รฟ hXY 0 if the two products are substitutes.
* Example: Wheat and corn
รฟ hXY 0 if the two products are complements.
* Example: Computers and computer software
รฟ hXY 0 if the two products are independent or unrelated.
* Example: Butter and airline tickets
รฟ Example: A linear demand function
* Given: QX 1,000 0.2PX 0.5PY 0.04I, QX 2,000, and
PY 500
* hXY 0.5(500/2,000) 0.125 so the two products are substitutes.
24 | Chapter 2
โข
Strategic management and the cross-price elasticity of demand
รฟ Managers can use information about the cross-price elasticity of
demand to predict the effect of competitorsโ pricing strategies on the
demand for their product.
รฟ Antitrust authorities use the cross-price elasticity of demand to determine the likely effect of mergers on the degree of competition in an
industry.
* A high positive cross-price elasticity, indicating that the two goods
are strong substitutes, suggests that a merger would significantly
reduce competition in the industry.
* A high negative cross-price elasticity of demand, indicating that
the two goods are strong complements, suggests that a merger might
give the merged firm excessive control over the supply chain. The
merged firm may refuse to sell the intermediate product to other
producers.
14. The Advertising Elasticity of Demand
โข
Advertising Elasticity of Demand (hA): The percentage change in quantity
demanded (Q) resulting from a 1% change in advertising expenditure (A)
โ Q โ โ A โ
รฟ A = โ
โ A โโ โโ Q โโ
รฟ Example calculation: A linear demand function
* Suppose: Q 500 0.5P 0.01I 0.82A and suppose, A/Q, the
amount of advertising per unit of output, is $2. Then
* hA 0.82(2) 1.64, indicating that a 1% increase in income results
in a 1.64% increase in the quantity demanded.
15. The Constant-Elasticity and Unitary Demand Function
โข
Constant-Elasticity Demand Function: Mathematical form of a demand
function that always yields that same elasticity, regardless of the productโs
price and consumersโ income and other factors that influence demand
รฟ Example: A multiplicative demand function
Q 200P 0.3I 2
รฟ Price elasticity of demand 0.3
รฟ Income elasticity of demand 2.0
รฟ More generally, an example of a constant elasticity demand function is
Q aP bIc
where a, b, c are parameters to be estimated.
รฟ Price elasticity of demand โb
รฟ Income elasticity of demand c
Demand Theory | 25
โข
รฟ Fact: For a multiplicative demand function, the exponents represent
elasticities.
Unitary elastic demand function and total revenue (TR)
รฟ TR PQ so if TR is constant, Q (TR)(P 1)
รฟ Price elasticity of demand 1
รฟ More generally, a unitary elastic demand curve is given by the demand
function
Q mP 1 or Q m/P
รฟ Its graph: A rectangular hyperbola
Chapter 2: Problem Solutions
1. The Dolan Corporation, a maker of small engines, determines that in 2012
the demand curve for its product is
P 2,000 50Q
where P is the price (in dollars) of an engine and Q is the number of engines
sold per month.
a. To sell 20 engines per month, what price would Dolan have to charge?
b. If managers set a price of $500, how many engines will Dolan sell per
month?
c. What is the price elasticity of demand if price equals $500?
d. At what price, if any, will the demand for Dolanโs engines be of unitary
elasticity?
Solution:
a. For Q 20, P 2,000 50(20) $1,000.
b. For P 500, we have 500 2,000 50Q. Solving for Q gives 50Q 1,500,
that is, Q 30.
c. h (โ Q /โ P)(P/Q) ( 1/50)(500/30) 1/3.
d. For P $1,000, h (โ Q/โ P)(P/Q) ( 1/50)(1,000/20) 1.
Alternatively, set (1/50)(2,000 50Q)/Q 1. Solve for Q and then P.
2. The Johnson Robot Companyโs marketing managers estimate that the
demand curve for the companyโs robots in 2012 is
P 3,000 40Q
where P is the price of a robot and Q is the number sold per month.
a. Derive the marginal revenue curve for the firm.
b. At what prices is the demand for the firmโs product price elastic?
c. If the firm wants to maximize its dollar sales volume, what price should
it charge?
26 | Chapter 2
Solution:
a. TR PQ (3,000 40Q)Q 3,000Q 40Q2. Hence,
MR dTR/dQ 3,000 80Q.
b. Recall: For a linear demand curve P a bQ, demand is elastic if P a/2.
Hence, we have P โฅ $1,500.
c. Revenue is maximized at MR 0. That is, 3,000 80Q 0. Solving for
Q gives Q 3,000/80 37.5 and therefore P 3,000 40(37.5), that is
P $1,500.
Alternatively, one can use the fact that for a linear demand curve
P a bQ, revenue is maximized at Q a/2b or P a/2.
3. After a careful statistical analysis, the Chidester Company concludes the
demand function for its product is
Q 500 3P 2Pr 0.1I
where Q is the quantity demanded of its product, P is the price of its product, Pr is the price of its rivalโs product, and I is per capita disposable income
(in dollars). At present, P $10, Pr $20, and I $6,000.
a. What is the price elasticity of demand for the firmโs product?
b. What is the income elasticity of demand for the firmโs product?
c. What is the cross-price elasticity of demand between its product and its
rivalโs product?
d. What is the implicit assumption regarding the population in the market?
Solution:
a. h (โ Q/โ P)(P/Q) ( 3)(10/1,110) 3/111
b. hI (โ Q/โ I)(I/Q) (0.1)(6,000/1,110) 60/111
c. hcross (โ Q/โ Pr)(Pr /Q) (2)(20/1,110) 4/111
d. The model for market demand implicitly assumes that the population is
constant.
4. The Haas Corporationโs executive vice president circulates a memo to the
firmโs top management in which he argues for a reduction in the price of the
firmโs product. He says such a price cut will increase the firmโs sales and
profits.
a. The firmโs marketing manager responds with a memo pointing out that the
price elasticity of demand for the firmโs product is about 0.5. Why is this
fact relevant?
b. The firmโs president concurs with the opinion of the executive vice president. Is she correct?
Demand Theory | 27
Solution:
a. Whether total revenue will go up or down when the product price is lowered and more units are sold depends on whether the quantity of units
sold increases by a greater percentage than the price is reduced by. That
is, it depends on whether the demand is elastic or inelastic. The nature of
the price elasticity of demand can be used as a test to determine the effect
of a price change on total revenue. This is the so-called total revenue test.
b. Assuming that the marketing manager is correct that the demand elasticity is 0.5, then demand is price inelastic and therefore a price reduction
will cause the number of units sold to increase by a smaller percentage
than price has fallen, and both the president and executive vice president
will have egg on their faces when total revenues decline after the price is
reduced.
5. Managers of the Hanover Manufacturing Company believe the demand
curve for its product is
P5Q
where P is the price of its product (in dollars) and Q is the number of millions of units of its product sold per day. It is currently charging $1 per unit
for its product.
a. Evaluate the wisdom of the firmโs pricing policy.
b. A marketing specialist says that the price elasticity of demand for the
firmโs product is 1.0. Is this correct?
Solution:
a. We have TR (5 Q)Q 5Q Q2 . Therefore,
MR 5 2Q.
At P 1, Q 4 and MR 3 and total revenue decreases. The price is
too low; increasing the price and selling fewer units would increase
revenues.
b. No, while dQ/dP 1, (dQ/dP)(P/Q) 1/4 at P 1.
6. On the basis of historical data, Richard Tennant has concluded, โThe consumption of cigarettes is . . . [relatively] insensitive to changes in price. . . .
In contrast, the demand for individual brands is highly elastic in its response
to price. . . . In 1918, for example, Lucky Strike was sold for a short time at
a higher retail price than Camel or Chesterfield and rapidly lost half its
business.โ
a. Explain why the demand for a par ticular brand is more elastic than the
demand for all cigarettes. If Lucky Strike raised its price by 1% in 1918,
was the price elasticity of demand for its product greater than 2?
28 | Chapter 2
b. Do you think that the demand curve for cigarettes is the same now as it
was in 1918? If not, describe in detail the factors that have shifted the
demand curve and whether each has shifted it to the left or right.
Solution:
a. As we define a product more narrowly, consumers have better substitutes
(whose prices are held constant) as the price of the good under consideration varies. This makes the demand for a good more elastic the more narrowly the good is defined. We are not told how much Lucky Strike was
priced above Camel and Chesterfield, but assuming that the margin was
less than 25%, we can conclude that the cross-price elasticity was greater
than 2. This isnโt exactly right; we must also assume that Lucky Strikeโs
fall in sales resulted from a reduction in the price of Camels and Chesterfields for the cross-price elasticities as explained to students.
b. Population, per capita income, and subsidized health care have all
increased; this probably caused the demand curve for cigarettes to shift
out, or to the right. Public health education and general education have
increased; this probably shifted the demand curve in, or to the left.
7. According to S. Sackrin of the U.S. Department of Agriculture, the price
elasticity of demand for cigarettes is between 0.3 and 0.4, and the income
elasticity of demand is about 0.5.
a. Suppose the federal government, influenced by findings that link cigarettes and cancer, were to impose a tax on cigarettes that increased their
price by 15%. What effect would this have on cigarette consumption?
b. Suppose a brokerage house advised you to buy cigarette stocks because if
incomes were to rise by 50% in the next decade, cigarette sales would be
bound to spurt enormously. What would be your reaction to this advice?
Solution:
a. Cigarette consumption would fall by between 4.5 and 6.0%.
b. Assuming that the prices of cigarettes were to remain constant, a 50%
increase in income would cause sales of cigarettes to increase 25%. The
weighted average of all income elasticities equals 1, so consumption of
noncigarette items would increase by more than 50% and certainly more
than the 25% performance of cigarettes. I would not follow the brokerโs
advice.
8. A survey of major U.S. firms estimates on average, the advertising elasticity
of demand was only about 0.003. Doesnโt this indicate that firms spend too
much on advertising?
Demand Theory | 29
Solution:
No. The fact that the elasticity of demand with respect to advertising is
relatively small (0.003) does not necessarily mean that an additional dollar
spent on advertising would not be profitable or that the last dollar spent was
not profitable. This number indicates that a 1% increase in advertising
expenditure results in a 0.003% increase in the quantity demanded of the
product.
9. The McCauley Company hires a marketing consultant to estimate the demand
function for its product. The consultant concludes that this demand function is
Q 100P3.1I 2.3A0.1
where Q is the quantity demanded per capita per month, P is the productโs
price (in dollars), I is per capita disposable income (in dollars), and A is the
firmโs advertising expenditures (in thousands of dollars).
a. What is the price elasticity of demand?
b. Will price increases result in increases or decreases in the amount spent
on McCauleyโs product?
c. What is the income elasticity of demand?
d. What is the advertising elasticity of demand?
e. If the population in the market increases by 10%, what is the effect on the
quantity demanded if P, I, and A are held constant?
Solution:
Observation: This is a multiplicative demand function.
Therefore, the exponents represent elasticities.
a. The price elasticity of demand is 3.1.
b. An increase in price will cause revenues to fall because the demand is
elastic.
c. The income elasticity of demand is 2.3.
d. The advertising elasticity of demand is 0.1.
e. If P, I, and A are held constant, per capita consumption, Q, is constant.
Notice that if N represents the population size, aggregate market demand
is given
QT 100NP3.1I 2.3A0.1
indicating that the population elasticity is 1.
Therefore, a 10% increase in population gives rise to a 10% increase in the
quantity demanded.
10. The Schmidt Corporation estimates that its demand function is
Q 400 3P 4I 0.6A
30 | Chapter 2
where Q is the quantity demanded per month, P is the productโs price (in
dollars), I is per capita disposable income (in thousands of dollars), and A
is the firmโs advertising expenditures (in thousands of dollars per month).
Population is assumed to be constant.
a. During the next decade, per capita disposable income is expected to
increase by $5,000. What effect will this have on the firmโs sales?
b. If Schmidt wants to raise its price enough to offset the effect of the
increase in per capita disposable income, by how much must it raise its
price?
c. If Schmidt raises its price by this amount, will it increase or decrease the
price elasticity of demand? Explain. Make sure your answers reflect the
fact that elasticity is a negative number.
Solution:
Observation: This is a linear demand function.
โQ
a. We have
= 4 , meaning that a $1,000 increase in per capita disposโI
able income results in a 4-unit increase in the quantity demanded of the
product. Therefore, if per capita disposable income is expected to
increase by $5,000, then the firmโs sales will increase by 20 units per
month.
b. Here, several variables are changing, not just one. Write
Q 3 P 4 I 0.6 A
3 P 4 I, assuming A is constant in the analysis. Now, offsetting the effect of the increase in per capita disposable income means that
the combined effects of a price increase and a per capita disposable income
increase leave quantity demanded unchanged. Hence,
3 P 4 I 0. Solving for P gives
P 20/3 $6.67. That is, price should be raised by $6.67 per unit.
c. There are two possible interpretations, both leading to more elastic
demand. You could assume that the question is asking if demand is
โQ
more elastic after both the income and price have increased. Since
is
โP
unchanged and P/Q has increased, the demand will be more elastic. Alternatively, you might assume that the question is asking, as we increase the
price to choke off the anticipated increase in the quantity demanded after
income has gone up, does the demand become more or less elastic? This
is, of course, just moving up a linear demand curve, which implies an
increasingly elastic demand.
Document Preview (19 of 316 Pages)
User generated content is uploaded by users for the purposes of learning and should be used following SchloarOn's honor code & terms of service.
You are viewing preview pages of the document. Purchase to get full access instantly.
-37%
Managerial Economics: Theory, Applications, And Cases, 8th Edition Solution Manual
$18.99 $29.99Save:$11.00(37%)
24/7 Live Chat
Instant Download
100% Confidential
Store
Evelyn Miller
0 (0 Reviews)
Best Selling
The World Of Customer Service, 3rd Edition Test Bank
$18.99 $29.99Save:$11.00(37%)
Chemistry: Principles And Reactions, 7th Edition Test Bank
$18.99 $29.99Save:$11.00(37%)
Solution Manual for Designing the User Interface: Strategies for Effective Human-Computer Interaction, 6th Edition
$18.99 $29.99Save:$11.00(37%)
Data Structures and Other Objects Using C++ 4th Edition Solution Manual
$18.99 $29.99Save:$11.00(37%)
Test Bank for Hospitality Facilities Management and Design, 4th Edition
$18.99 $29.99Save:$11.00(37%)
2023-2024 ATI Pediatrics Proctored Exam with Answers (139 Solved Questions)
$18.99 $29.99Save:$11.00(37%)